Gold prices remain elevated as traders brace for two major catalysts: Friday’s PCE inflation data and Donald Trump’s proposed tariffs. Both events could impact market sentiment, the U.S. dollar, and safe-haven demand. In this article, we analyze XAU/USD from macro, technical, and sentiment angles to prepare you for the next big move.
Introduction
Gold has re-entered the spotlight as market volatility picks up ahead of key macroeconomic events. With XAU/USD holding above the $3,000 level after a recent pullback, traders are closely monitoring developments that could trigger the next major move.
Two major catalysts dominate the outlook this week:
- The U.S. Personal Consumption Expenditures (PCE) inflation report, due on Friday, which serves as the Fed’s preferred gauge of price pressures
- Donald Trump’s proposed tariff regime, set to be unveiled on April 2, which could stoke inflation and renew risk-off sentiment
Meanwhile, the U.S. Dollar Index (DXY) has shown signs of weakness in recent sessions, providing short-term support to gold—but not without technical resistance.
In this report, we break down the XAU/USD outlook by examining:
- The macroeconomic landscape
- The relationship between gold and the dollar
- Key technical levels to watch
- Market sentiment gathered from top traders on X (formerly Twitter)
- Personal insights based on current chart formations
Whether you’re trading gold directly or looking to understand how these catalysts affect global FX flows, this analysis aims to equip you with actionable insight.
Macroeconomic Catalysts in Focus
PCE Inflation – The Fed’s Preferred Gauge
The Core PCE Price Index, due this Friday (March 28), is one of the most important data releases for markets this month. It serves as the Federal Reserve’s preferred measure of inflation, and traders view it as a key determinant for future monetary policy shifts.
Market expectations currently point to a YoY reading of 2.8%, slightly above the Fed’s 2% inflation target. A softer-than-expected print could:
- Reinforce dovish expectations
- Weaken the U.S. dollar (DXY)
- Support gold as real yields drop
In contrast, an upside surprise could:
- Delay rate cut expectations
- Strengthen the dollar
- Suppress gold demand in the short term
With gold being a non-yielding asset, its value is inversely correlated to real interest rates. Thus, Friday’s PCE data may serve as the next inflection point for XAU/USD.
Trump’s Tariff Proposal – Inflationary Shock or Market Relief?
President Donald Trump has signaled a two-step tariff regime, with details expected around April 2. Early headlines suggest levies may target:
- Automobiles
- Buyers of Venezuelan oil
- Aluminum and other commodities
If implemented aggressively, such tariffs could:
- Stoke inflationary pressure across global supply chains
- Trigger renewed safe-haven demand for gold
- Increase expectations for stagflation scenarios
On the other hand, if Trump softens his stance or includes exemptions, markets may interpret this as risk-positive, potentially pushing gold into a consolidation phase.
Either way, traders should prepare for elevated volatility across metals, commodities, and dollar pairs heading into April.
Dollar Index (DXY) and Its Relationship with Gold
Inverse Correlation: A Long-Standing Dynamic
Gold (XAU/USD) and the U.S. Dollar Index (DXY) have historically exhibited an inverse correlation—when the dollar weakens, gold tends to rise, and vice versa. This relationship stems from gold being priced in U.S. dollars, making it cheaper for international buyers when the greenback declines.
Over the past month, the DXY has retreated by approximately 3.4%, supporting gold’s push toward all-time highs. However, recent chart action suggests a complex backdrop ahead.
Technical Picture: Bearish Trend Meets Structural Support
As of March 26, 2025 (12:20 UTC), the DXY is trading around 103.83, hovering just above a monthly support zone between 100 and 101—a level visually highlighted by traders as a key area of interest.
A few technical observations:
- The 20-day moving average on the daily chart remains in a downward slope, indicating a short-term bearish trend.
- While DXY has approached the 20-day MA, there’s a risk of a “false breakout”, where price briefly pierces the moving average before resuming its downtrend.
- Notably, a “harami” pattern formed on March 11 (a large bearish candle containing seven subsequent smaller candles). On March 21 and 24, price attempted to break above the March 11 open—but upside momentum stalled.
This suggests that while momentum was building, the descending 20-day MA is capping gains, making it a key resistance line in the coming sessions.
Implications for XAU/USD
If the DXY fails to break higher and instead revisits the 100–101 support zone, it could trigger renewed upside in gold, especially if PCE data surprises to the downside or geopolitical risk re-emerges.
Conversely, a reversal higher in DXY, supported by strong inflation or hawkish rhetoric, may suppress gold and limit bullish breakout attempts.
As such, gold traders must not only monitor XAU/USD’s own chart but also maintain a close watch on the DXY’s interaction with:
- The 20-day moving average
- The key support zone at 100–101
- Momentum indicators around March’s harami breakout attempt
Technical Analysis: XAU/USD Chart Levels to Watch
Consolidation After All-Time High
Gold (XAU/USD) recently printed a new all-time high at $3,057.59, before pulling back and entering a sideways consolidation phase. Despite this pullback, the broader trend remains bullish, supported by macro uncertainty, central bank demand, and a weakening U.S. dollar.
As of March 26, XAU/USD is trading near $3,027, holding above a key psychological support at $3,000. The price action over the past several sessions suggests indecision, with traders awaiting confirmation from upcoming catalysts like PCE data and Trump’s tariff policy.
Bearish Candle Formation: A Potential Warning?
Notably, the daily candles from March 21 to 25 form a curved pattern resembling a downward-bending arc, often interpreted as a potential reversal setup.
Some traders refer to this as a “bowstring” or parabolic fade, where a short-term peak is followed by increasingly hesitant candles, often leading to a minor retracement.
Key insight from one trader’s observation:
“These three candles look like they’re pulling back a bow before a downward move.
Even during rallies, we often see the opposite — a ‘pulling upward’ arc before takeoff.”
While this pattern doesn’t guarantee a drop, it reflects fading bullish momentum that could lead to a test of lower supports if macro catalysts disappoint.
Key Support and Resistance Levels
| Level | Significance |
|---|---|
| $3,057.59 | All-time high and major resistance |
| $3,030–$3,040 | Intraday resistance zone; breakout trigger |
| $3,000 | Psychological support; widely watched |
| $2,968.92 | Near-term support, recent reaction low |
| $2,874.97 | 50-day moving average; key for longer-term trend confirmation |
A clean break above $3,057 could trigger further upside toward $3,100–$3,150, especially if supported by weak inflation and geopolitical tailwinds.
On the downside, a loss of $2,968 could lead to a pullback toward the 50-day MA, which still aligns with the longer-term uptrend.
Chart Watch Summary
- Trend: Bullish bias remains intact
- Near-term momentum: Weakening slightly
- Setup: Consolidation with breakout potential or minor correction
- Trigger zones:
- Upside: Break above $3,030 and $3,057
- Downside: Break below $2,968
Traders should stay alert for volatility following macro events. These levels could act as inflection points based on market reaction to data and policy shifts.
Trader Sentiment from X (formerly Twitter)
As macro uncertainty grows, traders on X (formerly Twitter) are actively sharing their takes on how gold (XAU/USD) might react to the dual impact of PCE inflation data and Trump’s upcoming tariffs. Below is a curated selection of notable posts reflecting sentiment across different angles:
XAU/USD & Trump Tariff Reactions
#GOLD starts to turn flat with markets digesting Trump’s secondary tariffs:
Gold holds above $3,000, eyes ATH at $3,057.
Needs a breakout to escape selling pressure.
→ Highlights the tug-of-war between technical resistance and safe-haven demand.
$GOLD rises above $3,010/oz on US tariff developments.
Trump warns of auto tariffs & 25% levy on Venezuelan oil.
→ Suggests tariffs are fueling a bid in gold.
Gold rose above $3,010 per ounce… as traders assessed U.S. tariff developments.
→ Signals steady buying interest amid geopolitical uncertainty.
PCE Inflation Anticipation
This week brings Core PCE — the Fed’s preferred inflation measure — on March 28.
A key print for monetary policy shifts.
→ Points to heightened event risk ahead of Friday’s data.
The softer inflation outlook and dovish Fed tilt may support risk assets,
but quarter-end positioning could distort price action.
→ Adds nuance: traders are watching both data and structural flows.
Dollar Index & DXY Correlation
If you’re trading USD pairs without checking DXY, you’re trading blind!
DXY down = XAU/USD up.
→ Reinforces the inverse relationship between the dollar and gold.
Gold Breakout Scenarios
Expecting gold to rise to $3,053 following a bearish trendline breakout.
→ Sees upside continuation if resistance is cleared.
Gold forming bull flag. Breakout above $3,030 could lead to new ATH around $3,090.
→ Technical patterns aligning with bullish outlook.
Summary of Sentiment
- 🟡 Mild bullish bias: Most traders view $3,000 as solid support and are eyeing $3,030–$3,057 as the key breakout zone.
- 🔻 Short-term caution: Many are hesitant due to event risk from PCE and political headlines.
- 📊 DXY awareness rising: Multiple traders emphasize watching dollar movements as a key input for gold.
Overall, sentiment leans cautiously bullish, but conviction remains tied to macro outcomes, particularly inflation data and tariff clarity.
Analyst Commentary & Personal Insight
While gold remains technically supported and sentiment shows cautious optimism, the current setup leaves room for both breakout and pullback scenarios. From a holistic standpoint, the market is coiled around a few key variables—each capable of tilting the bias sharply.
Gold’s “Bowstring” Formation – A Trader’s Observation
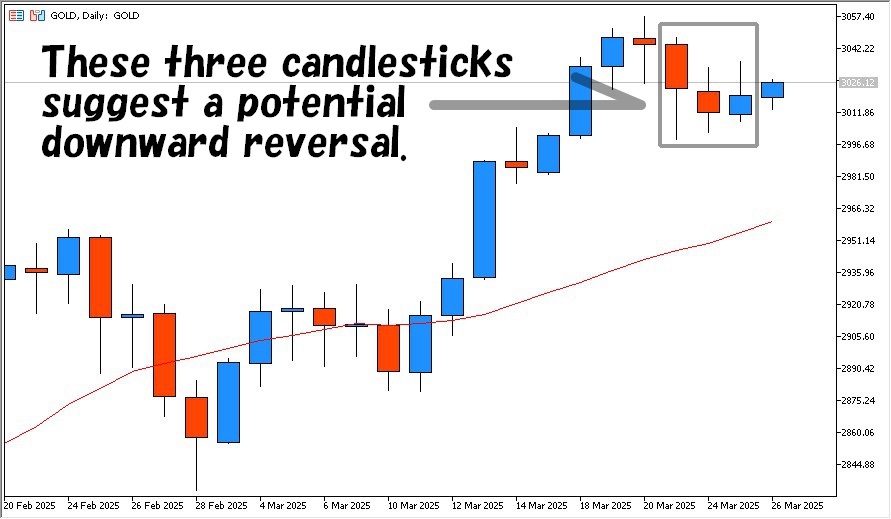
Analyzing the daily chart of XAU/USD reveals a subtle yet noteworthy candlestick pattern. The candles from March 21 to 25 form a curved arc, resembling a bow being drawn downward. This type of formation—while not a textbook pattern—is something experienced traders often associate with waning momentum and a potential short-term reversal.
“This 3-day arc looks like a bowstring being pulled — we often see this shape just before a correction, especially after strong moves.”
This insight reflects how price structure itself can give clues, even in the absence of clear indicators. Importantly, such formations can appear at both bullish and bearish turning points, and are best confirmed by a break of key levels.
DXY: Support or Breakdown?
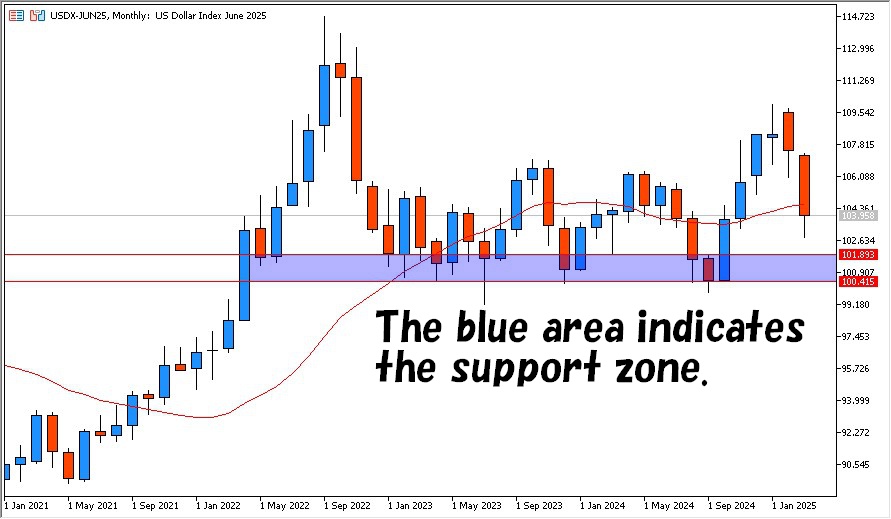
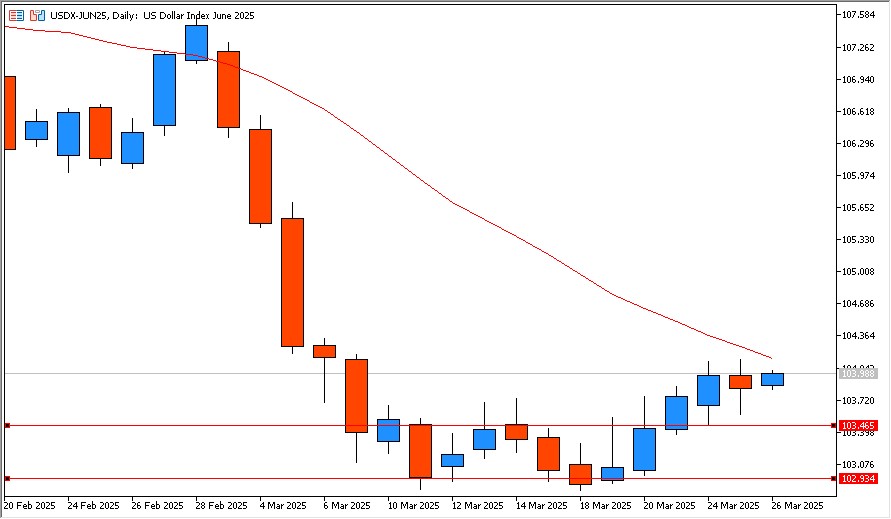
On the USD side, the U.S. Dollar Index (DXY) is trading near a multi-month support zone between 100 and 101, while its 20-day moving average is sloping downward. A “harami” pattern from March 11 suggests potential breakout pressure, but the inability to sustain momentum above the 20-day MA casts doubt on any bullish breakout attempt.
If DXY breaks below 101, it could act as a tailwind for gold — especially if Friday’s PCE data comes in softer than expected.
However, if PCE surprises to the upside or if Trump’s tariff announcement triggers a risk-off USD bid, then gold could struggle to push through $3,030 resistance.
Personal Market View
Based on current price structure and sentiment:
- Scenario 1 – Bullish breakout: A soft PCE print and muted tariff risk could push XAU/USD through $3,030–$3,057, opening a path toward $3,100–$3,150.
- Scenario 2 – Minor pullback: If inflation surprises to the upside or the dollar rebounds off support, we could see a dip toward $2,968, with the 50-day MA ($2,875) as deeper support.
- Scenario 3 – Sideways chop: With quarter-end rebalancing and mixed macro signals, gold may consolidate in a $2,980–$3,030 range until early April.
From a risk management standpoint, traders should be reactive, not predictive — wait for confirmation around breakout levels and monitor DXY closely alongside macro headlines.
Conclusion
Gold (XAU/USD) remains at a critical juncture, with price action hovering near the $3,000 mark amid a backdrop of macro uncertainty and technical hesitation. The next move hinges on two powerful catalysts:
- Friday’s Core PCE inflation data, which may shift expectations around the Fed’s rate path
- Trump’s tariff announcement, due early April, which could stoke inflation fears or spark risk aversion
Technically, gold is consolidating just below all-time highs, with traders watching the $3,030–$3,057 zone for a potential breakout — or signs of rejection.
The U.S. Dollar Index (DXY) adds another layer of complexity:
- A break below the 100–101 support zone could fuel further gains in gold
- A dollar rebound, especially if PCE surprises to the upside, may trigger a pullback toward $2,968 or even $2,875
Key Takeaways for Traders
- 📅 Event risk is high — stay alert around March 28 (PCE) and April 2 (Tariff Plan)
- 📊 Watch the chart — price structure hints at consolidation, but momentum can shift quickly
- 🧭 Let the levels lead — act on confirmation, not prediction
- 💵 Track the DXY — gold’s next move is tightly linked to dollar direction
In an environment shaped by inflation expectations, geopolitical tension, and shifting rate bets, gold remains a key barometer of market sentiment.
Sources
- FXEmpire. Gold News: Safe-Haven Demand Rises as Traders Brace for PCE and Tariff Decisions. Published March 24, 2025.
https://www.fxempire.com/forecasts/article/gold-news-safe-haven-demand-rises-as-traders-brace-for-pce-and-tariff-decisions-1506540