- 📘 Chapter 1: Introduction
- 📘 Chapter 2: Trade Setup & Strategy
- 📘 Chapter 3: TP/SL Setup with Risk Ratio
- 📘 Chapter 4: What Triggered the Early Exit
- 📘 Chapter 5: What If I Had Held the Trade?
- 📘 Chapter 6: Key Lessons & Strategy Adjustments
- 📘 Chapter 7: Strategy Reproducibility & Expected Value Notes
- 📘 Chapter 8: Conclusion
- 📌 Update (May 19): Trade Reached Take Profit
📘 Chapter 1: Introduction
How a Solid FX Strategy Was Undone by Emotion
I thought I had done everything right.
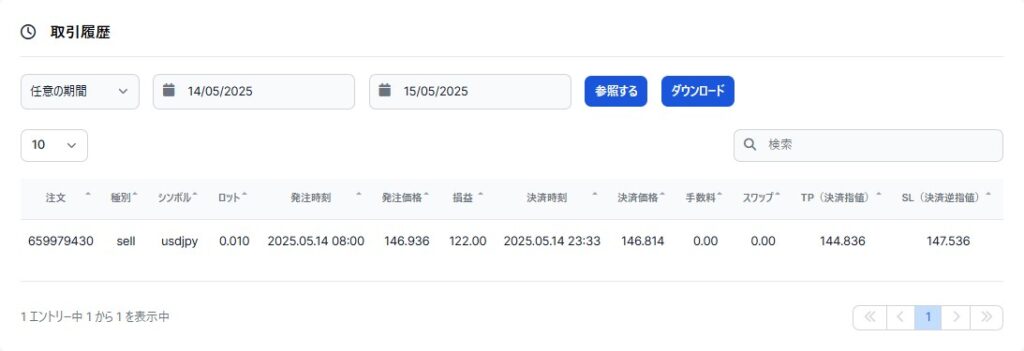
I followed my trusted strategy—the Ama-chan 3x Check Method—and entered a USD/JPY short position on May 14th at 146.936. I had a clear trade setup, calculated my stop loss and take profit with a solid 1:3.5 risk-reward ratio, and planned to let the market do its work.
But the market had other plans—and so did my emotions.
Despite being up over 120 pips at one point, I ended up closing the trade for just 12 pips. It wasn’t a technical issue, or a flaw in the strategy. It was fear. The kind of fear that creeps in during a late-night chart check and pushes you to “just take the profit” before it disappears.
In this post, I’ll walk you through that trade:
- The setup
- The mistake
- The lessons
- And how I’m refining my rules to avoid making the same error again.
If you’ve ever closed a trade too early only to watch it hit your take-profit target later, this story is for you.
📘 Chapter 2: Trade Setup & Strategy
Why I Entered the Trade—And Why I Broke My Own Rules
This trade was based on the Ama-chan 3x Check Method, a system where I review the USD/JPY 8-hour chart three times a day to identify low-effort, high-reward setups. The method typically follows strict rules:
- Enter only when the 9-period MA is below the 36-period MA (for short trades)
- Take a position when the price closes below the 9MA on the 8-hour chart
- Set a risk-reward ratio of 1:3.5 using clearly defined stop loss and take profit levels
- Let the trade run until TP or SL is hit—no manual interference
But this time, I broke the very first rule.
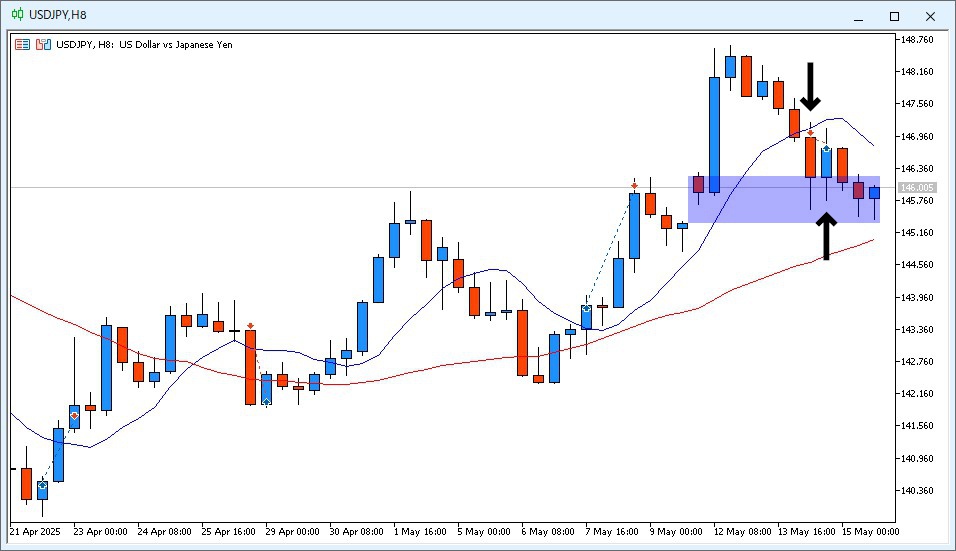
On May 14th, at the 14:00 candle, I noticed the USD/JPY 8-hour candle had closed below the 9MA, which signaled a short. However, the 9MA was still above the 36MA, indicating an uptrend—not a textbook short setup.
So why did I still enter?
Because I saw room for the price to retrace toward the 36MA. Even though it was technically a countertrend entry, I expected a short-term pullback. I told myself it was a “calculated exception.” But in hindsight, it was the first crack in my discipline.
Sometimes, it’s not the big decisions that derail a strategy—it’s the small compromises we make along the way.
📘 Chapter 3: TP/SL Setup with Risk Ratio
A Textbook Risk-Reward Plan—At Least on Paper
Once I entered the short at 146.936, I followed the strategy’s standard position management rules.
Here’s how I set my targets:
- Stop Loss (SL): 147.536
→ 60 pips above the entry, in case the uptrend resumed - Take Profit (TP): 144.836
→ 210 pips below the entry, targeting a clean move down to a key level - Risk-Reward Ratio: 1:3.5
The logic was simple:
Even if I lost this trade, the next three wins at this ratio could more than make up for it. That’s the core advantage of the Ama-chan method: it doesn’t require a high win rate—as long as the losses are small and the gains are large.
Everything was set.
Technically, I had no reason to intervene unless the price hit one of the two levels.
But as I would soon learn, a well-crafted plan only works if you trust it enough to stick with it.
📘 Chapter 4: What Triggered the Early Exit
Fear, Night Charts, and the Whisper of Loss Aversion
At first, everything looked fine.
By 22:00 on May 14th, the 8-hour candle had closed as a strong bearish bar. My short position was in profit—up over 120 pips—and it seemed like the price was heading straight for my take-profit level.
But then came the late-night volatility.
Between 23:00 and 01:00, USD/JPY began to rally sharply. While it hadn’t reached my stop loss, the bounce was strong enough to shake my confidence. I went to bed uneasy, with that uncomfortable “what if it reverses?” feeling gnawing at me.
I woke up around 5:30 AM, unable to resist checking the chart.
And there it was—my floating profit had shrunk to just 12 pips.
Panic whispered.
“What if this keeps going up?”
“What if I lose everything I’ve gained?”
Instead of trusting the plan, I reacted emotionally.
I closed the trade right then and there.
Looking back, this was classic loss aversion. The fear of losing unrealized gains outweighed the logic of a high-RR trade. I wasn’t thinking in probabilities—I was thinking in pain.
And pain makes terrible trading decisions.
📘 Chapter 5: What If I Had Held the Trade?
From 12 Pips to 120—The Missed Opportunity
After closing the trade for just 12 pips, I couldn’t stop thinking about “what might have been.”
Throughout the day, I kept checking the chart—almost obsessively.
Here’s what happened next:
- The 6:00–14:00 8-hour candle closed bearish
- The 14:00–22:00 candle? Also bearish
- And by 22:30, the price was hovering around the +120 pips zone from my original entry
In other words, my trade idea was right. The price moved just as I had hoped—without ever hitting my stop loss.
But I wasn’t in the trade anymore.
I also realized something deeper: I had completely overlooked the price gap that formed between last Friday’s close and this Monday’s open. That gap acted as a support zone and temporarily blocked price momentum. If I had factored that in, I might have expected a temporary pullback—and had the confidence to stay in the trade.
Instead, I let fear dictate the exit.
That’s what made this loss worse:
Not the lack of profit, but the fact that the market followed my plan—and I didn’t.
📘 Chapter 6: Key Lessons & Strategy Adjustments
Turning Regret into Rules
This wasn’t just a missed trade. It was a mirror.
It showed me where my strategy was solid—and where my mindset still needs work. Here are the key lessons I’m taking away:
✅ 1. A good setup means nothing if you don’t follow through
My entry logic was valid, and the risk-reward was excellent. But discipline failed, and that erased everything. From now on, I’m treating rule-following as part of the trade setup itself—not optional.
✅ 2. For countertrend trades, define tactical exit points
When going against the trend (like this one), I now have two new conditional exit signals:
- If price touches the 36MA, consider exiting
- If price fills a major gap, reassess the trade
These tactical exits will help me make smarter decisions—without emotional panic.
✅ 3. Price gaps are psychological zones—don’t ignore them
The unfilled gap between Friday’s close and Monday’s open ended up acting as a powerful support.
I had seen it… but didn’t factor it in.
From now on, gaps will be part of my pre-entry scenario planning.
✅ 4. You can’t control emotions—but you can control exposure to them
The more I stare at charts, the more likely I am to act emotionally.
That’s why I’m going to reinforce the “3x check only” rule.
If my system says “wait,” I wait—even if my nerves say otherwise.
Trading is not just about finding good trades. It’s about executing with consistency.
That’s the next level I’m aiming for.
📘 Chapter 7: Strategy Reproducibility & Expected Value Notes
Test Results
Out of 2 past trades: 2 wins / 0 losses (+222.2 pips total)
Current average pips gained: +111.1 pips
Note: Expected value and win rate will continue to be updated through ongoing testing.

📘 Chapter 8: Conclusion
Even a Great Strategy Can’t Save You from Yourself
This trade had everything going for it:
- A clear entry signal
- A favorable risk-reward setup
- Strong market structure alignment
And yet, I walked away with just 12 pips, while the market offered 120+.
Not because the strategy failed—
but because I didn’t trust it enough to stay the course.
That’s the reality of trading:
Even the best plans fall apart when fear takes the wheel.
But this isn’t just a loss—it’s a milestone.
I’m walking away with sharper rules, deeper insight, and a little more self-awareness.
If you’ve ever felt the urge to close a trade too early…
If you’ve watched the price go exactly where you thought it would—after you bailed…
Then I hope this story helps you feel seen, and reminds you that growth comes through these moments.
The market will always test our strategy.
But more often, it tests our patience, confidence, and emotional control.
Let’s keep showing up—with plans, discipline, and honesty.
📌 Update (May 19): Trade Reached Take Profit
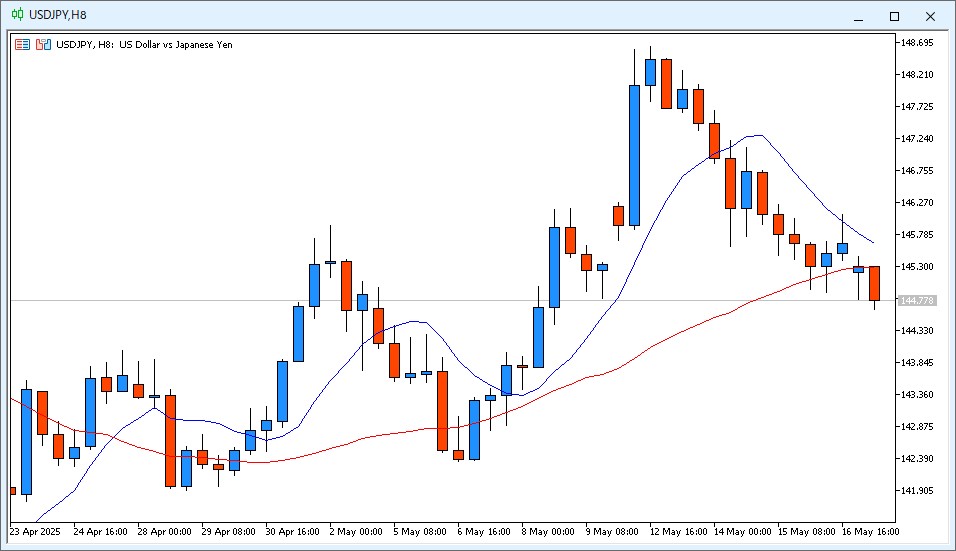
Had I followed the original plan without exiting early,
the USD/JPY short would have hit the +210 pips take profit target on Day 4—May 19.
This confirms that the strategy itself was valid.
The true challenge was not the market, but my ability to trust the system.
That’s what I’ll continue to work on from here.