Introduction: Why Instinct-Based Trading Fails
“I keep losing in Forex. Maybe I just don’t have the talent.”
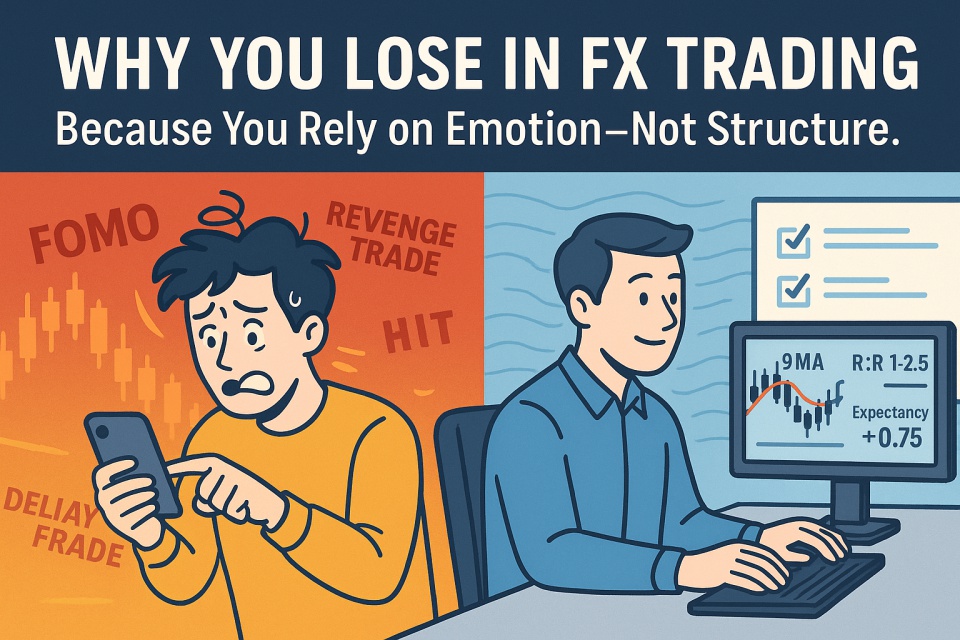
If you’ve ever thought this, you’re not alone. But the real reason most traders fail has nothing to do with talent—and everything to do with relying on instincts instead of structure.
❌ The Trap of Emotion-Driven Trading
Many traders fall into the same loop:
- Entering trades based on gut feeling or chart “vibes”
- Holding onto losses hoping they’ll recover
- Changing strategies after just a few losses
This instinctive style may work once in a while, but over time, it leads to inconsistent results and emotional burnout.
🎯 The Key Shift: From Emotion to Structure
Winning consistently in Forex isn’t about having perfect intuition.
It’s about building a repeatable structure based on:
- Market volatility (how far price typically moves)
- Risk-reward ratios and expectancy
- Clear entry/exit rules based on edge
Think of it like this:
You’re not trying to “guess right”—you’re trying to run a statistically sound system.
📌 This Guide Will Show You How
In this 7-step guide, you’ll learn how to:
- Set realistic profit targets based on volatility
- Design rules that generate positive expectancy
- Identify high-probability setups
- Track and refine your strategy like a business
If you’re tired of chasing the market and want a way to trade with clarity and confidence, this guide is for you.
Let’s start by understanding how to define your trade targets using average volatility.
- Chapter 1: Know Your Timeframe’s Volatility
- Chapter 2: Build a Positive Expectancy Model
- Chapter 3: Spot High-Probability Setups
- Chapter 4: Backtest and Track Your Rules
- Chapter 5: Turn Strategy into Daily Habit
- Chapter 6: Grow Confidence with Data-Driven Patterns
- Chapter 7: Manage Strategy Like a Business
- Conclusion|From Reaction to Execution: The Trader’s Shift
Chapter 1: Know Your Timeframe’s Volatility
Why understanding price range is the first step to strategy design
📊 Why You Must Know the Average Range
Before you build any Forex strategy, you must first understand this:
How far does your chosen currency pair typically move within your timeframe?
If you’re trading:
- Scalping? → Know the 15–30 minute average range
- Day trading? → Know the daily range (like ATR(14) on the daily chart)
- Swing trading? → Look at the weekly average range
This knowledge helps you answer:
- How far can price realistically move today?
- Is there enough room for my target to be hit?
- Am I entering too late in the move?
💡 Example: USD/JPY Day Trading
Let’s say you’re day trading USD/JPY, and the 14-day average daily range is 170 pips.
If the pair has already moved 165 pips upward, do you still want to go long?
Probably not—there’s limited room left.
📌 Volatility tells you whether there’s enough opportunity left in the move.
📐 How to Calculate It
You can use:
- ATR (Average True Range) indicator
- Manual calculation using high–low differences across recent candles
On platforms like MT4/MT5, TradingView, or cTrader, applying ATR(14) is a standard way to estimate volatility.
🧭 Define Your Target Range Before Anything Else
If you don’t know the average range of your timeframe, setting a profit target is like driving with no destination.
You need a clear idea of how much the market usually gives you before deciding how much to aim for.
Once you know your typical target range, you can move on to defining risk-reward and calculating your break-even win rate.
Chapter 2: Build a Positive Expectancy Model
The math behind a strategy that grows your account over time
💬 What Is Expectancy, and Why Does It Matter?
Expectancy is the average amount you can expect to win (or lose) per trade over the long run.
It answers this core question:
“If I take this trade setup 100 times, will I make money?”
You don’t need to win most of the time.
What matters is how much you win when you’re right vs. how much you lose when you’re wrong, and how often.
🧮 The Formula for Expectancy
Expectancy=(W×A)−(L×B)
Where:
W= Win rateA= Average winL= Loss rate (1 – W)B= Average loss
💡 Example: Risk-Reward Ratio 1:2.5
Let’s say you’re risking 40 pips to gain 100 pips. That’s a 1:2.5 R:R ratio.
Now calculate the break-even win rate:
Break-even win rate=1/(1+2.5)=1/3.5≈28.57%
This means:
Even if you lose 7 out of 10 trades, you’re still profitable—as long as you follow the setup and manage risk correctly.
📐 Set Your Risk and Reward Based on Market Volatility
In Chapter 1, you learned how to determine a realistic reward based on your timeframe’s average range.
Once that’s known, decide your risk by choosing your preferred risk-reward ratio.
For example:
- Target = 100 pips
- R:R = 1:2
- Risk = 50 pips
Now you know what price level your stop-loss should be.
🧠 Why This Model Is Crucial
Without this structure:
- You might win often but still lose money (if losses are too big)
- You might chase unrealistic profit targets
- You’ll never know if your edge is real or just lucky variance
📌 Expectancy is how professional traders evaluate systems.
You’re not trying to win one lucky trade. You’re building a model that wins over time.
Chapter 3: Spot High-Probability Setups
How to identify “edge” at trend reversals using moving averages
🔍 What Is an Edge?
An “edge” in trading refers to a repeatable condition where the odds are tilted in your favor.
Most traders lose because they enter trades with no statistical edge—only hope or fear.
So, where does edge exist?
📌 One of the most powerful edges is found at trend reversal points.
📈 The Edge at Trend Reversals
Let’s use the USD/JPY 8-hour chart as an example.
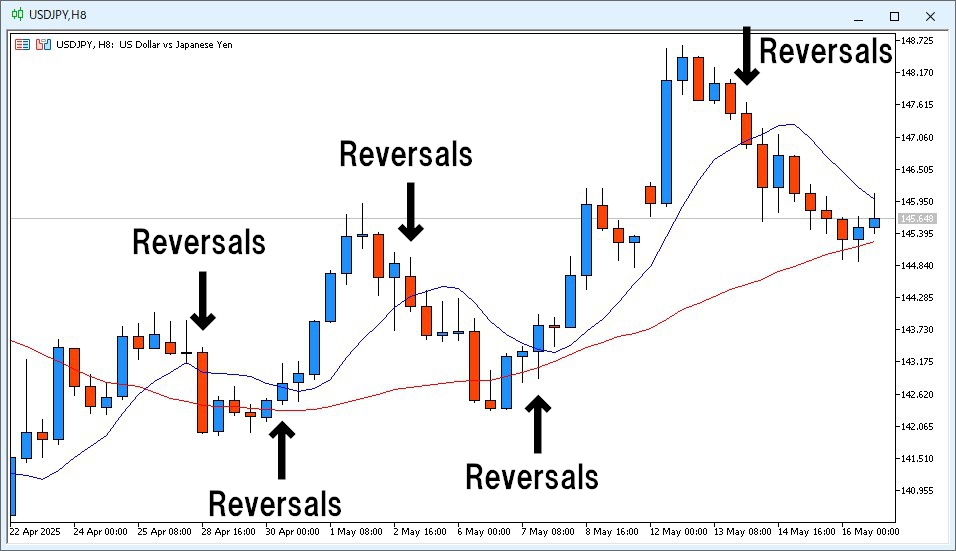
When price crosses the 9-period moving average (9MA), it often signals a potential shift in trend direction.
Entering at the open of the next candle after this crossover can offer a high-probability opportunity for profit.
📊 Example: Backtesting the 9MA Crossover Setup
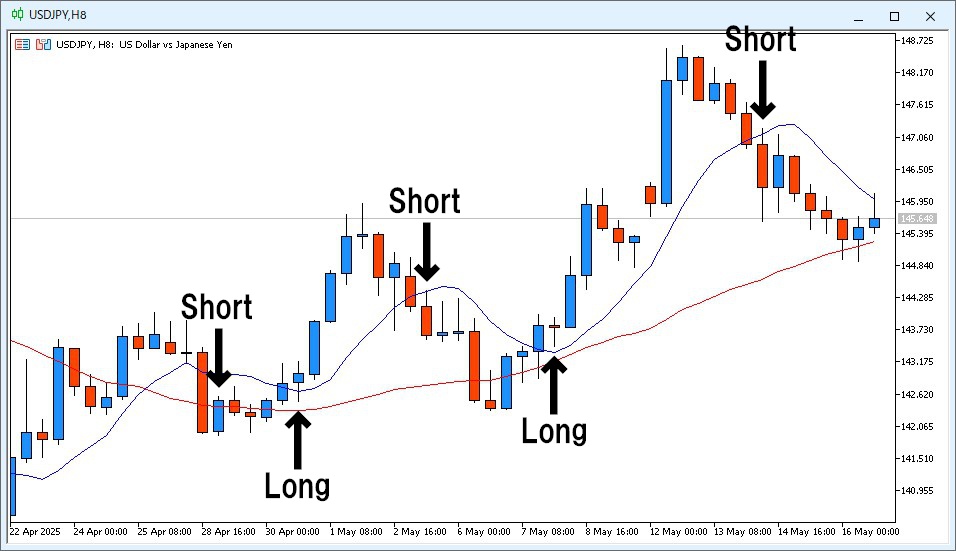
Here’s a sample result from backtesting trades based on the 9MA crossover strategy:
- Entry Rule: At the open of the candle following the reversal signal
- Risk-Reward Ratio: 50 pips risk / 100 pips reward (1:2)
- Trade Results: 4 wins and 1 loss out of 5 trades
| Trade # | Direction | Outcome | P/L |
|---|---|---|---|
| 1 | Short | Loss | -50 pips |
| 2 | Long | Win | +100 pips |
| 3 | Short | Win | +100 pips |
| 4 | Long | Win | +100 pips |
| 5 | Short | Win | +100 pips |
Total Net Gain: +350 pips
This illustrates how trading with clearly defined risk and favorable reward can consistently generate profits.
📌 These setups—where risk is limited but potential return is large—are what we call true “edges” in the market.
⚠️ Why Most Traders Miss This
- It “feels wrong” to go against the previous trend
- Price hasn’t “proven” the new trend yet
- The setup looks like a pullback or trap
- Emotionally, it’s hard to enter at the start of a reversal
But by the time the trend becomes obvious, the best entry is long gone.
This is why people say, “I buy, and it drops. I sell, and it goes up.”
They’re always chasing, never leading.
🧠 Use “Delayed Indicators” to Your Advantage
Many say “moving averages are lagging tools,” but that’s exactly why they work.
They help you confirm a shift has occurred.
Instead of guessing, you’re waiting for evidence of a new phase.
✅ Strategy Tip: Timeframe & MA Pairing
Use moving averages that fit the timeframe:
- 5-minute chart → Try 12MA & 48MA
- 1-hour chart → Try 6MA & 24MA
- 8-hour chart → Try 9MA & 36MA (like in the Ama-chan Method)
Each pair corresponds to 1× and 4× higher timeframe weights.
Chapter 4: Backtest and Track Your Rules
Data turns strategies into confidence—and confidence into action
📊 Why Backtesting Matters
No matter how great your strategy looks on paper, it means nothing until you test it.
Backtesting allows you to answer the most important question:
“Has this setup actually worked in the past?”
Without historical proof, you’re just guessing.
Backtesting:
- Verifies if your edge holds up across market conditions
- Gives you statistical confidence in your plan
- Helps you refine entries, exits, and filters
🧪 Simple Backtesting Checklist
- Define entry and exit rules clearly
- Go bar by bar on historical charts
- Record each trade: direction, result, pips gained/lost, R-multiple
- Calculate win rate and expectancy
- Identify patterns: When does it work best? When does it fail?
You don’t need fancy software.
Tools like TradingView or MT4 with manual logging in Excel or Notion are enough to start.
📈 Sample Tracking Sheet (Minimalist Style)
| Trade # | Setup Type | Entry Time | Direction | Result | P/L (pips) | R-Multiple |
|---|---|---|---|---|---|---|
| 1 | 9MA Cross | April 29 | Short | Loss | -50 | -1.0 |
| 2 | 9MA Cross | May 14 | Short | Win | +100 | +2.0 |
📌 After 20–30 trades, you’ll begin to see patterns—and your confidence will shift from hope to logic.
🧠 Why Most Traders Skip This
- It’s time-consuming
- It’s not “fun”
- They’d rather jump into live trades
But skipping this step is like skipping flight training before piloting a plane.
You don’t trade for entertainment—you trade for results.
Chapter 5: Turn Strategy into Daily Habit
Consistency isn’t built by emotion—it’s built by routine.
🔁 Why Habits Matter More Than Motivation
Most traders fail not because their strategy is flawed—
but because they don’t follow it consistently.
Why?
Because they rely on emotion instead of routine.
📌 Discipline becomes easy when it’s part of your schedule.
🕒 The Power of a Daily Trading Routine
Having a set process for when and how you trade keeps your mind calm and focused.
Example:
The Ama-chan FX Method – 3 Chart Checks a Day
- Check USD/JPY at 6AM, 2PM, and 10PM JST
- Use the 8-hour chart
- Scan for 9MA/36MA crossover setups only
- Log results and ignore everything else
You don’t need to stare at charts all day.
You just need a structure that respects your time and mindset.
✍️ Make Your Strategy Visual
Turn your rules into a simple checklist.
Post it on your wall or save it to your desktop.
Sample Trading Routine Template:
- ✅ Is price crossing the 9MA with clear direction?
- ✅ Is risk-reward at least 1:2 or higher?
- ✅ Does price have enough room within the average range?
- ✅ Is this within scheduled chart check time?
If yes → Take the trade.
If no → Walk away.
🧘♂️ Less Noise, More Clarity
The more automated your decisions are, the less stress you’ll feel.
Routine removes hesitation.
Structure defeats emotion.
And that’s how you become consistent.
Chapter 6: Grow Confidence with Data-Driven Patterns
Confidence doesn’t come from winning—it comes from knowing why you won.
🧠 Why Confidence Must Be Earned, Not Assumed
Many traders chase the market in search of “confidence.”
They think one big win will change everything.
But true confidence in trading is built when:
You see the same setup work again and again—across data, not memory.
📊 From Raw Numbers to Reliable Patterns
Once you’ve logged 20–30 trades, patterns start to emerge:
- You win more on trend reversals than trend continuations
- Your strategy works best in London session, not Tokyo
- Your setups fail when volatility is below average
These insights aren’t emotional—they’re statistical truths.
And they give you the evidence-based confidence needed to scale up.
🗂️ Turn Data into a “Playbook”
Organize your trades like case studies.
Mark winning patterns, market conditions, entry types, and what to avoid.
Sample Review Notes:
- ✅ Best setup: 9MA cross after ranging consolidation
- ❌ Avoid: entries right before high-impact news
- 🧭 Entry window: 6AM–10AM JST shows better follow-through
📌 Your job is not to trade everything.
Your job is to specialize in what works—for you.
🚀 Confidence Compounds
The more you see your plan succeed in backtests and forward tests,
the less doubt you carry when it’s time to execute.
Confidence isn’t noise.
Confidence is proof—measured and repeated.
Chapter 7: Manage Strategy Like a Business
Your trading isn’t a hobby—it’s a performance-based operation.
🏢 Think Like a Business Owner, Not a Gambler
Would a successful business:
- Change its product every week?
- Set random prices?
- Skip monthly reviews?
Of course not.
Yet that’s how many traders treat their strategies.
📌 If you want consistent results, treat your trading like a business—not a bet.
📋 Use a “Strategy Management Table”
Create a dashboard to monitor your trading systems like business units.
Example Columns:
| Strategy Name | Win Rate | Avg R:R | Expectancy | Drawdown | Confidence Score |
|---|---|---|---|---|---|
| 9MA Crossover | 68% | 1:2.2 | +0.75R | -2R max | High |
This gives you clarity on:
- What’s working
- What needs improvement
- Where to allocate more capital
📆 Monthly Strategy Review Sheet
At the end of each month, ask:
- How many trades did I take per strategy?
- Which setups performed best?
- Did I follow my rules?
- What’s my biggest lesson?
Your trading deserves the same operational review as any serious business.
🧭 Strategic Adjustments, Not Emotional Reactions
Don’t ditch your system after one bad week.
Don’t scale up after one good week.
React to data, not to emotion.
Build systems, measure performance, and refine with intent.
Conclusion|From Reaction to Execution: The Trader’s Shift
Winning trades don’t come from instincts—they come from structure.
🎯 What Separates Losing Traders from Consistent Ones?
Not intelligence.
Not motivation.
Not even experience.
The real difference is structure.
Losing traders react.
Winning traders execute—based on rules, data, and repeatable behavior.
✅ What You’ve Built Through This Guide
By following the 7 steps, you’ve created something rare:
- A trading strategy based on volatility awareness
- A risk-reward structure with positive expectancy
- A method to identify edge (not just enter at random)
- A system to test, track, and review your results
- A mindset that turns your process into daily habit
- A framework to build data-based confidence
- A business approach to strategy management
This isn’t just a “setup.”
It’s a repeatable trading engine.
🚀 Your Next Step
Don’t stop here.
Put it into motion.
- Backtest 30 trades
- Track results in your template
- Spot patterns
- Refine your playbook
- Execute with precision
📌 You’re no longer a trader hoping to win.
You’re a trader running a system designed to win.
Ready to take control of your trading?
Then stop reacting—and start executing.