- 📝 Introduction
- 🧪 Chapter 1: Understanding EIA Oil Stock Reports and Market Mechanics
- 📈 Chapter 2: Structural Shifts Revealed in 3-Year Oil Inventory Trends
- ⛽️ Chapter 3: California’s Gas Price Surge: Supply Strains and Policy Risks
- 📉 Chapter 4: WTI Monthly Chart Analysis: Key Breakdowns and Price Targets
- 💡 Chapter 5: Forex Strategies for USD/CAD and USD/JPY in a Falling Oil Market
- 📅 Chapter 6: Key Economic Events to Watch in May 2025
- 🧭 Final Chapter: Conclusion & Strategic Takeaways
📝 Introduction
Why are forex traders watching oil inventory data more closely than ever in May 2025?
Because the usual weekly EIA report now coincides with a perfect storm: a technical breakdown in WTI crude, elevated gasoline prices in California, and a packed calendar featuring the FOMC and U.S. CPI.
WTI’s fall below the $67 level in April triggered a technical shift that could push prices toward the low $40s—raising red flags for commodity-linked currencies like the Canadian dollar (CAD). Meanwhile, structural fuel supply issues in the U.S. West Coast are keeping pump prices high, potentially offsetting the disinflationary narrative from falling crude.
This article dives into how oil inventories and energy market dynamics feed into USD/CAD and USD/JPY trends—and how to align your strategy ahead of the key economic releases in early May.
Whether you’re positioning around FOMC expectations or mapping out commodity-FX correlations, this is your tactical brief for a volatile stretch in the FX market.
🧪 Chapter 1: Understanding EIA Oil Stock Reports and Market Mechanics
The U.S. Energy Information Administration (EIA) releases weekly crude oil inventory data every Wednesday at 10:30 a.m. Eastern Time. For forex traders, this isn’t just an energy market event—it’s a potential volatility trigger for currency pairs linked to oil and inflation expectations.
🔍 Why Oil Inventories Matter in FX
When crude oil stocks rise more than expected, it suggests weaker demand or oversupply, which can weigh on oil prices. This, in turn, may pressure oil-sensitive currencies such as:
- CAD (Canadian Dollar) – Canada is a major oil exporter; falling oil prices can lead to CAD weakness.
- USD (U.S. Dollar) – Indirectly influenced, especially when energy price shifts affect inflation and Federal Reserve policy expectations.
A bullish oil inventory print (drawdown or bigger-than-expected drop) typically boosts WTI crude prices and strengthens CAD. A bearish print (build or unexpected surplus) does the opposite.
⚙️ How the Market Reacts
- USD/CAD tends to move in inverse correlation with WTI prices:
📉 Crude down → CAD weakens → USD/CAD up
📈 Crude up → CAD strengthens → USD/CAD down - USD/JPY, though less directly linked, reacts when oil-related inflation or Fed rate expectations shift:
Strong inflation → Hawkish Fed → Dollar up
Oil-led disinflation → Dovish Fed → Dollar down
📌 Key Takeaway
The EIA report isn’t just a number—it’s a sentiment pulse for risk appetite, inflation, and commodity FX.
In May 2025, amid technical breaks in WTI and supply disruptions in California, this weekly report could carry even more weight than usual.
📈 Chapter 2: Structural Shifts Revealed in 3-Year Oil Inventory Trends
Oil inventory numbers are often viewed in isolation—weekly surprises that nudge prices up or down.
But a deeper look at multi-year inventory trends reveals larger shifts in supply, demand, and storage dynamics that shape the market’s direction over time.
🕰 The 3-Year View: What the Chart Tells Us
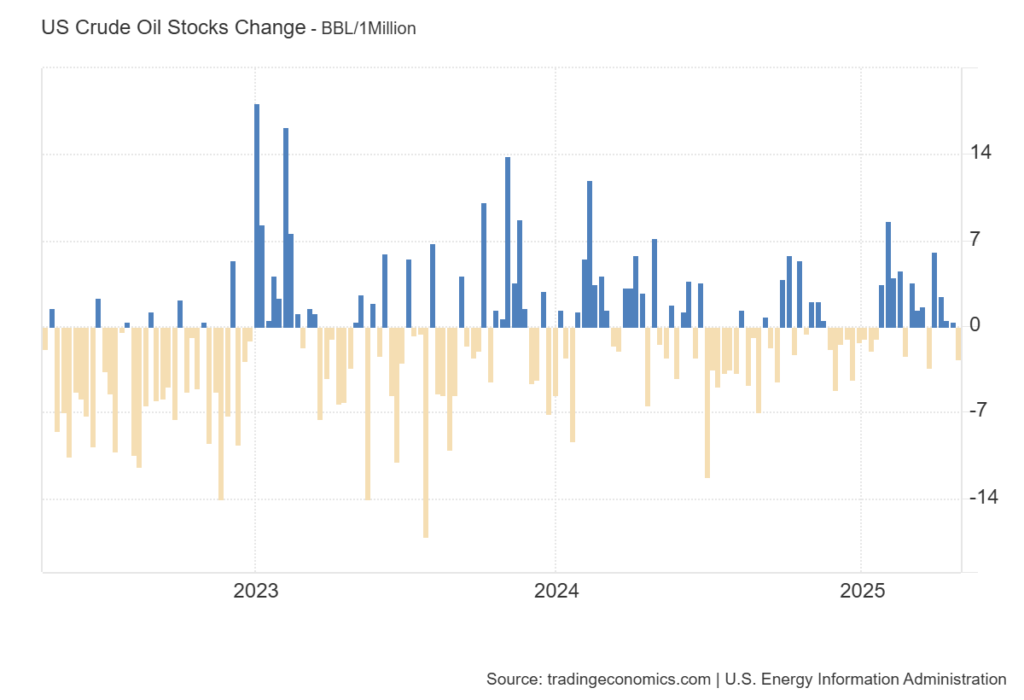
The U.S. crude oil stock change chart from 2022 to 2025 shows several notable patterns:
- More frequent builds and smaller drawdowns since mid-2023, indicating sluggish demand or overproduction.
- Volatility in stock changes has declined, suggesting a tighter balancing act between refiners and demand signals.
- Seasonal effects—like summer driving season drawdowns—are less pronounced than in pre-2020 patterns.
These trends point to a supply-heavy environment where even modest disruptions or policy changes can tip the balance sharply.
🔧 What This Means for Traders
- Reduced drawdowns = downside pressure on oil prices.
A consistent inability to meaningfully lower stockpiles weakens bullish oil narratives. - WTI becomes more reactive to macro and geopolitical catalysts (e.g., refinery closures, Middle East tensions), as inventory alone no longer justifies upside moves.
- For FX traders, this suggests that CAD’s strength may become increasingly reliant on external demand shocks or OPEC+ action, rather than inventory-driven rebounds.
📌 Key Takeaway
The past three years reveal a market that’s quietly shifted toward persistent oversupply.
This structural tilt adds weight to every EIA release in 2025—and it’s one reason WTI’s technical breakdown may not find easy support.
⛽️ Chapter 3: California’s Gas Price Surge: Supply Strains and Policy Risks
While WTI prices have broken key technical support levels, gasoline prices in California remain stubbornly high. This divergence highlights a critical structural problem in U.S. energy logistics—and has broader implications for inflation and policy expectations.
🔍 Why California Prices Defy the WTI Trend
According to the U.S. Energy Information Administration (EIA), California drivers face the highest prices at the pump in the nation. In March 2025:
- Environmental program costs (e.g., Cap-and-Trade, Low Carbon Fuel Standard) added up to $0.54/gallon.
- Taxes and fees totaled nearly $0.90/gallon, the highest in the U.S.
- Six refineries have closed since 2008, and two have been converted to renewable fuel production.
As a result, California increasingly relies on imports from Asia (India, South Korea) to meet local demand—a costly and vulnerable supply chain.
🏛️ Regulatory Pressure and Future Risk
- In late 2024, Governor Newsom signed ABX2-1, allowing regulators more control over refinery inventories to prevent shortages.
- Yet even with these controls, major players like Phillips 66 and Valero are exiting refining operations, citing market dynamics and compliance burdens.
These developments suggest that structural bottlenecks—not just market prices—are driving local fuel inflation.
💱 FX Implications: Sticky Inflation Risks
- Persistently high retail gasoline prices can complicate the disinflation narrative.
- If headline CPI stays elevated due to gasoline, rate cut expectations may be delayed, supporting the U.S. dollar in the medium term.
- This dynamic adds another layer to USD/JPY positioning, especially in the lead-up to CPI and FOMC announcements.
📌 Key Takeaway
California’s fuel price surge is not a short-term anomaly—it reflects long-term supply constraints and regulatory friction.
For FX traders, it reinforces the idea that commodity prices and monetary policy are more tightly intertwined than ever.
📉 Chapter 4: WTI Monthly Chart Analysis: Key Breakdowns and Price Targets
In April 2025, WTI crude decisively broke below the long-standing support level around $67, which had held for years. This was not just a routine dip—it marked a technical breakdown with medium-term bearish implications.
🧭 Fibonacci Perspective: The $67 Breakdown
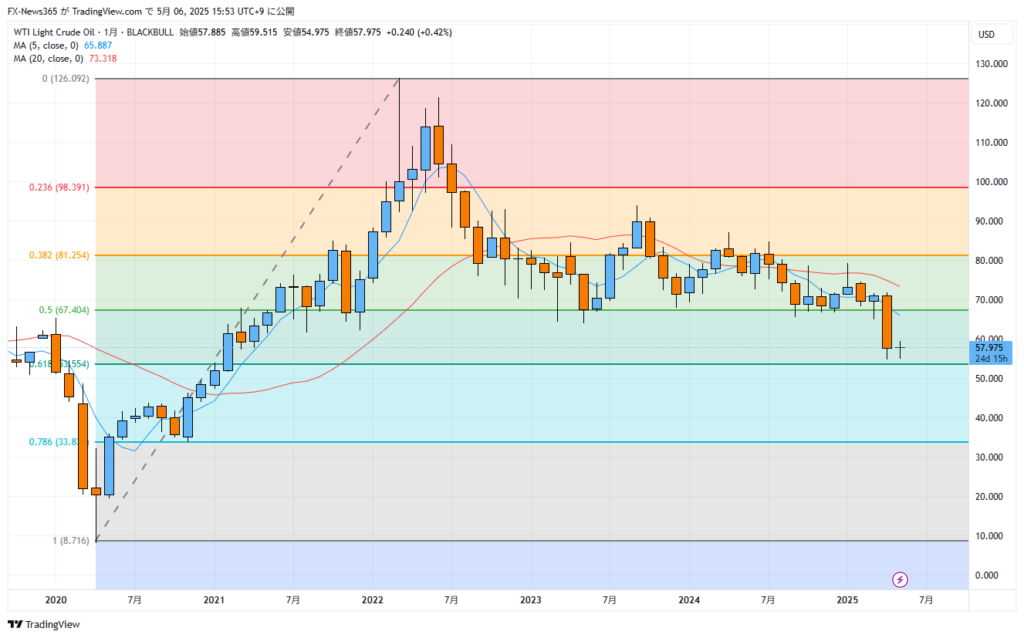
A Fibonacci retracement drawn from the pandemic low in April 2020 to the Ukraine war high in March 2022 reveals that:
- The 50% retracement level sits at $67.40.
- This level had aligned closely with monthly chart support, creating a psychological floor.
- The April 2025 close decisively breached this line, signaling a loss of structural support.
With no major technical barriers between current prices and the $43–45 range, downside momentum could persist unless demand rebounds sharply or supply is disrupted.
🧮 Multi-Year Trend View
- The 5-month moving average has crossed below the 20-month moving average, forming a bearish crossover—often a signal of trend continuation.
- Volume patterns suggest sellers are not exhausted, indicating that bears still have control.
💱 FX Implications: CAD in Focus
- WTI’s downtrend tends to pressure CAD, as oil export revenues decline and GDP expectations weaken.
- This aligns with a USD/CAD bullish bias, especially if the pair breaks above its 20-day moving average on the daily chart (see next chapter).
- For traders eyeing oil-linked FX plays, technical breakdowns in commodities often precede macro FX rotations.
📌 Key Takeaway
The $67 level wasn’t just another price—it was a multi-year equilibrium point.
Its breach opens the door to deeper declines in crude and, by extension, adds medium-term bearish pressure on the Canadian dollar.
💡 Chapter 5: Forex Strategies for USD/CAD and USD/JPY in a Falling Oil Market
With WTI breaking below multi-year support and inflation data looming, FX traders are navigating a complex macro landscape. Let’s break down the strategic implications for USD/CAD and USD/JPY, the two pairs most immediately impacted by oil price movements and U.S. monetary policy.
🇨🇦 USD/CAD: Poised for a Bullish Break?
🟢 Medium-Term View (Monthly Chart):
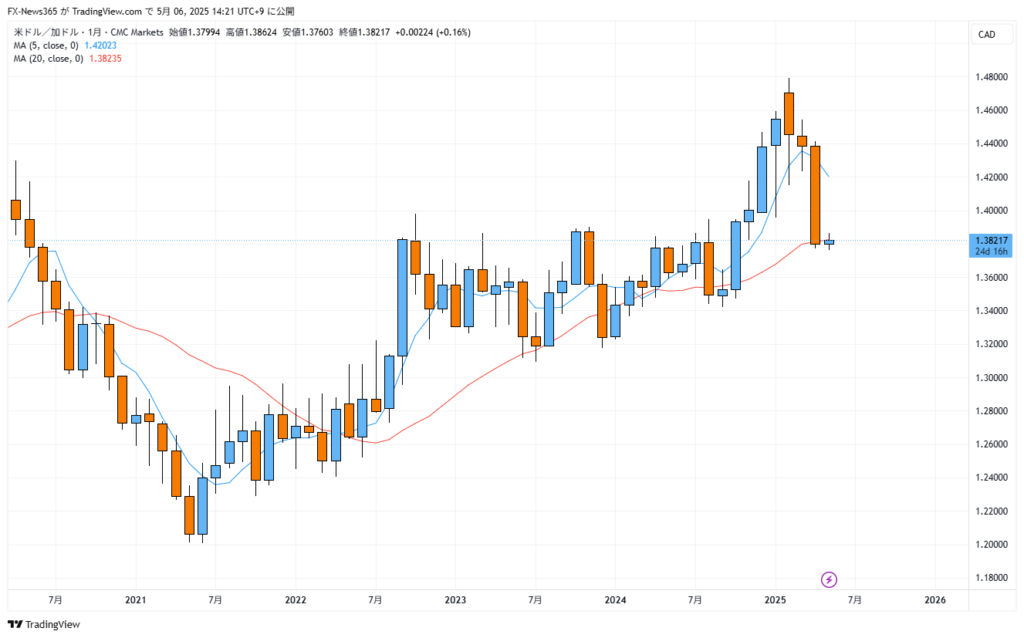
- USD/CAD is currently hovering around 1.3800, where the 20-month moving average acts as support.
- As oil prices decline, this level may serve as a launchpad for further CAD weakness, pushing the pair higher.
🔍 Short-Term View (Daily Chart):
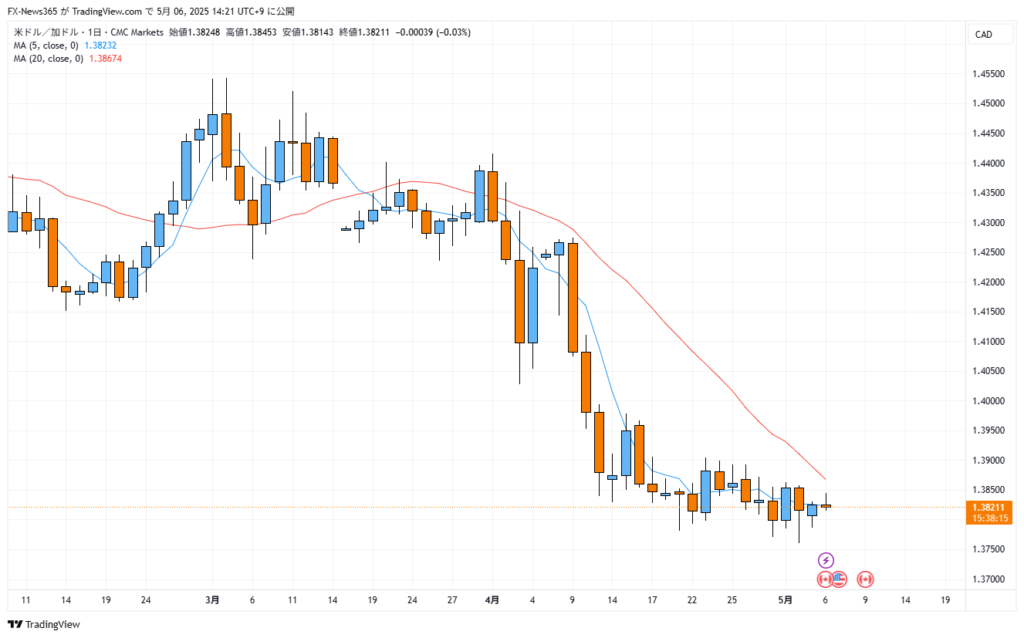
- The pair has been range-bound for 17 days, compressing below a downward-sloping 20-day moving average.
- If price breaks above this moving average, it could trigger a bullish breakout, targeting 1.40.
- If the resistance holds, 1.3500 remains the downside target.
Strategy Tip:
Traders may look to fade CAD strength and position long on USD/CAD only after a confirmed breakout above the daily 20MA, aligning with WTI’s bearish trend.
🇯🇵 USD/JPY: Mixed Signals, Event-Driven Risk
🟡 Monthly Chart:
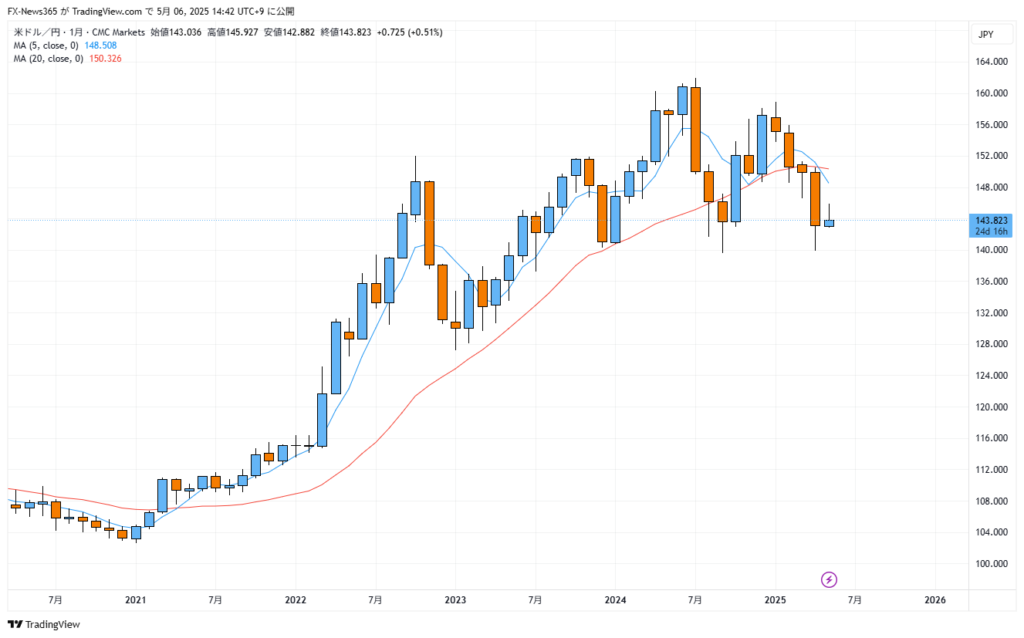
- USD/JPY has support around 143.00, with a more significant anchor zone near 141.00.
- A 5-month / 20-month moving average death cross has just formed, a medium-term bearish signal.
🟢 Daily Chart:
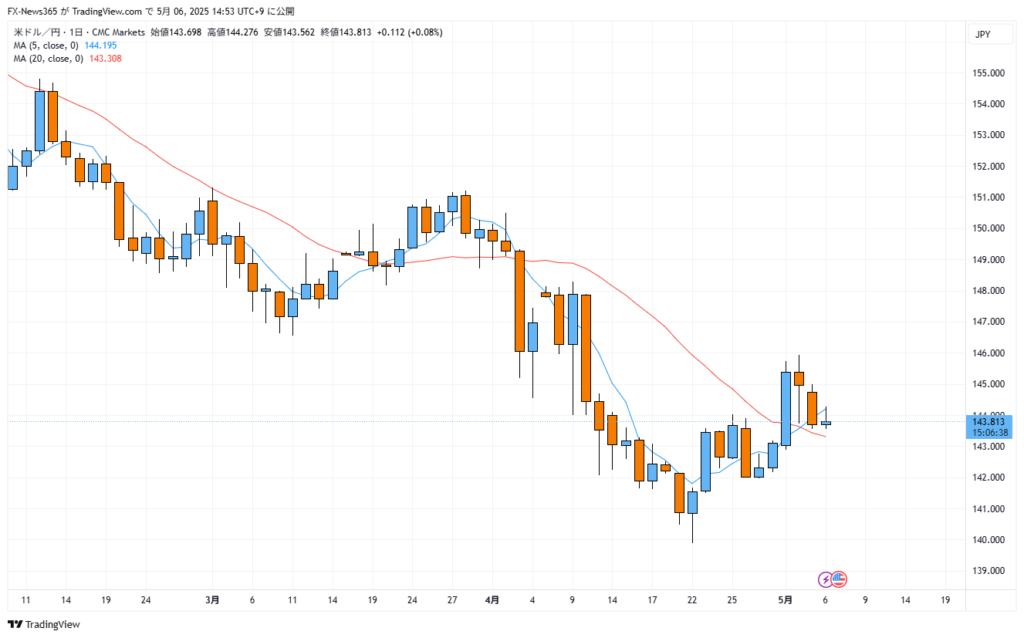
- The pair has broken above its 20-day moving average, indicating short-term dollar strength.
- However, this upside move may be fragile ahead of key U.S. data (FOMC & CPI).
Strategy Tip:
Consider a two-tiered approach:
- Trade the short-term bullish move cautiously toward 145.00,
- But prepare for downside potential if 141.00 breaks, which would open the path to 136.00 or even 130.00.
📌 Key Takeaway
- USD/CAD is increasingly driven by oil sentiment and stands at a technical inflection point.
- USD/JPY reflects broader dollar sentiment, but chart and fundamentals diverge.
- In both pairs, timing entries around key levels and events (like the EIA, FOMC, and CPI) will be crucial for risk management and directional confidence.
📅 Chapter 6: Key Economic Events to Watch in May 2025
The first half of May 2025 presents a high-impact calendar cluster that could drive volatility across commodities and major FX pairs. For traders navigating oil-sensitive currencies like CAD or macro-sensitive pairs like USD/JPY, timing around these events is critical.
🗓 Key Dates (All times in JST)
| Date | Time | Event | Market Focus |
|---|---|---|---|
| May 7 (Wed) | 23:30 | 🇺🇸 EIA Crude Oil Inventories | Direct impact on WTI & USD/CAD |
| May 8 (Thu) | 03:00 | 🇺🇸 FOMC Rate Decision | Potential USD/JPY catalyst |
| May 13 (Tue) | 21:30 | 🇺🇸 April CPI | Directional driver for USD across the board |
🔍 Why These Events Matter
- EIA Oil Inventories (May 7):
Comes at a time when WTI has lost major support. A larger-than-expected build could trigger another leg down in oil prices, pressuring CAD and benefiting USD/CAD longs. - FOMC Decision (May 8):
While no rate change is expected, forward guidance is key. Any dovish tone could weaken USD, especially if inflation expectations drop further due to lower energy prices. - CPI Data (May 13):
This will reveal how much recent oil price movements have filtered into headline inflation.
A sticky CPI could reignite hawkish Fed expectations and drive USD/JPY higher.
💡 Tactical Notes
- These events are closely spaced, creating a compressed volatility window.
- Market reactions may compound: a bearish EIA print followed by a hawkish CPI could create a double impact on USD pairs.
- Be prepared for whipsaw price action around these releases, and consider using smaller position sizes or wider stops during event windows.
📌 Key Takeaway
May 2025 isn’t just about one indicator—it’s a sequence of catalysts that overlap.
Traders who understand the order and weight of these events will be better positioned to act decisively and avoid getting caught on the wrong side of volatility.
🧭 Final Chapter: Conclusion & Strategic Takeaways
The May 2025 oil inventory report is more than just a weekly data release—it’s part of a broader narrative involving technical breakdowns, structural supply strains, and shifting monetary policy expectations.
The breach of $67 in WTI marks a psychological and technical turning point, reinforcing bearish pressure on oil and raising red flags for commodity-linked currencies like the Canadian dollar. At the same time, persistently high gasoline prices in California signal inflationary stickiness, complicating the Fed’s decision-making process and directly affecting USD/JPY dynamics.
✅ Key Takeaways Recap
- WTI’s break below $67 confirms a medium-term downtrend, with potential targets near $43–45.
- USD/CAD remains coiled below resistance; a bullish breakout is possible if oil continues to slide.
- USD/JPY reflects a tug-of-war between technical signals and monetary policy outlook.
- May’s trifecta of EIA, FOMC, and CPI will define FX momentum into early summer.
📣 Strategic CTA for Traders
If you’re trading CAD or JPY, now is the time to:
- Align your technical setups with the macro event calendar
- Monitor oil price action before and after the EIA release
- Stay nimble around FOMC and CPI volatility windows
📰 FX News 365 continues to deliver expert analysis that connects the dots between commodities, policy, and currency markets.
Follow us for more FX insights and stay ahead of the next macro move.