
🌅 Introduction: A Desert Sunset and a Directionless Market
While checking charts from my desk in Japan, I imagined myself riding a camel through the golden sands of the Moroccan desert—proof that the freedom of trading extends far beyond any one location.
This journal entry captures a market moment that felt as unpredictable as desert wind:
USD/JPY moved sharply on U.S. data, only to lose direction again by the Tokyo open. A long upper wick on the latest 8-hour candle reflects this indecision—bullish pressure rising and fading in the same breath.
As always, I rely on the rules of my “Ama-chan 3-Time Daily Check Method” to guide decisions. No guessing. No chasing. Just a calm observation of structure and discipline.
Let’s take a closer look at the current setup and what this uncertain movement means for the ongoing short position.
“I wanted to ride a camel through the Moroccan desert,
so here’s today’s trade update—straight from the Sahara at sunset (well, kind of 😄)!”
📘 Chapter 1: Trade Setup & Current Position
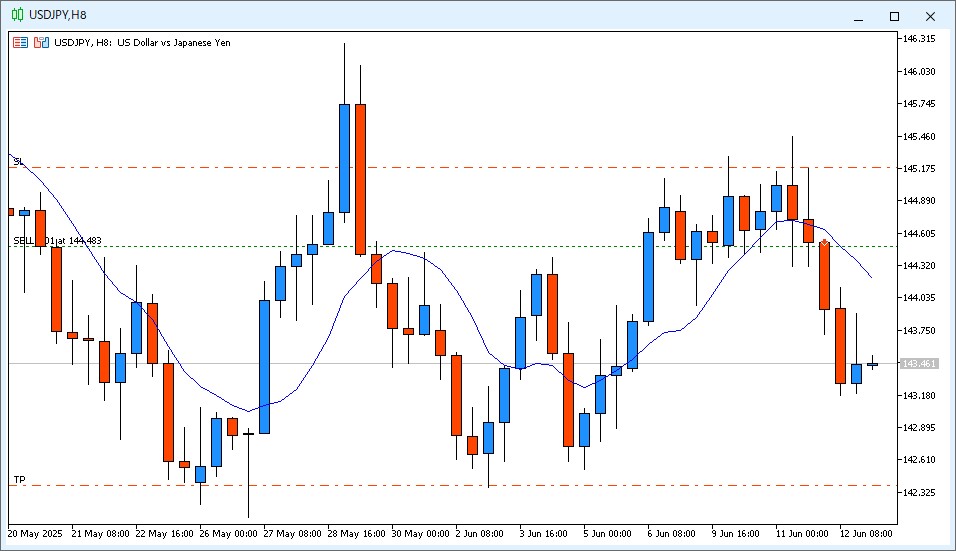
As part of the “Ama-chan 3-Time Daily Check Method,” I currently hold a short position on USD/JPY based on a clean technical signal observed earlier this week.
On June 11, a bearish candlestick closed decisively below the 9-period moving average (9MA) on the 8-hour chart, prompting an entry at 144.483. Since then, the price has gradually shifted downward, and the trade remains active with a clear take-profit and stop-loss structure.
Here are the current trade details:
| Parameter | Details |
|---|---|
| Currency Pair | USD/JPY |
| Timeframe | 8-hour chart |
| Position | Short |
| Entry Price | 144.483 |
| Stop Loss (SL) | 145.183 (-70 pips) |
| Take Profit (TP) | 142.383 (+210 pips) |
| Lot Size | 0.01 (demo trade) |
| Entry Reason | Bearish candle closed below the 9MA |
| Strategy | The Ama-chan FX Method |
As of the morning of June 13, the position is floating with approximately +100 pips in unrealized profit, and the short bias is still valid as price action remains below the 9MA despite a temporary intraday rebound.
📊 Chapter 2: Key Economic Events – June 13, 2025
While no major U.S. releases are scheduled for June 13, one domestic data point from Japan deserves attention—Industrial Production (MoM) for April, set to be released at 13:30 JST.
Although this is a lagging indicator, it can still influence short-term yen sentiment, especially in thin liquidity conditions during the Asian session. However, the main driver of the recent volatility was yesterday’s U.S. Jobless Claims and May Producer Price Index (PPI), both of which triggered sharp price movements in USD/JPY.
Here’s a quick recap of the key event:
| Time (JST) | Currency | Event |
|---|---|---|
| 13:30 | JPY | Industrial Production (MoM, April) |
Traders should remain cautious during the Tokyo session, particularly if the pair reacts unexpectedly to this data release. However, the broader market focus has already shifted to how the U.S. inflation picture is evolving and its implications for the Fed.
📅 Chapter 3: Tokyo Morning Review – Price Action Breakdown
At 6:30 AM JST on June 13, I launched MT5 for the first daily chart check. The most recent 8-hour candlestick (covering 22:00–06:00) had closed as a small bullish candle with a long upper wick—a signal of intraday indecision or possible rejection at higher levels.
Despite the bullish body, price remained below the 9-period moving average, which is a key condition for maintaining the short position under the Ama-chan Method. Based on this, the short was held.
What makes this setup especially tricky is the choppy movement following the U.S. data released at 21:30 JST the previous evening. Initially, USD/JPY plunged as the markets reacted to:
- Higher-than-expected Jobless Claims
- May PPI (MoM) data, which signaled slowing inflation
However, by 22:00, the pair rebounded to 143.894, a move suggesting temporary dollar strength, before rolling over again as the yen regained buying interest.
This whipsaw action reflects a market lacking clear directional momentum, making it especially difficult for trend-following traders. Yet, the 9MA filter is doing its job—helping me stay grounded in structure rather than reacting emotionally to every move.
🕑 June 13 – 2:00 PM JST Check (Tokyo Afternoon Session)
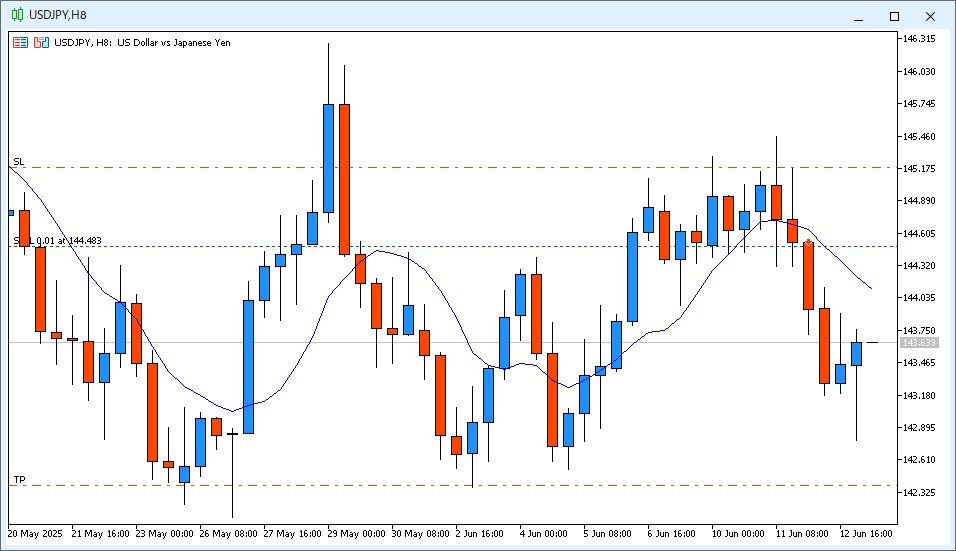
Position: SELL 144.483
Stop Loss: 145.183
Take Profit: 142.383
- Candle Close: Bullish candle with an ~85-pip lower wick (pin bar formation)
- Price vs. 9MA: Price remains below the 9-period moving average
- Decision: Hold (floating profit around 80 pips)
💬 Although the lower wick suggests some buying pressure, we’re still within a broader range and price hasn’t touched the lower band yet. I’ll stick to the plan and hold the short. Hope remains for a move down toward TP.
📅 June 13, 2025 – 10:00 PM Chart Check (22:00 JST)
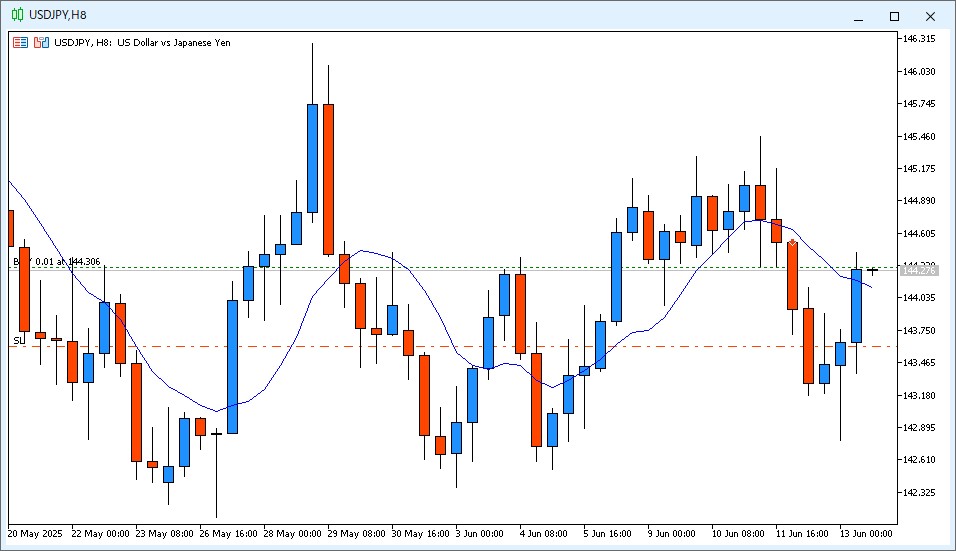
At the 10:00 PM chart check, the latest 8-hour candlestick on USD/JPY closed as a strong bullish candle that broke above the 9MA from below. This signal met the condition for two actions under the Ama-chan Method:
- Close the current short position
- Open a new long position immediately
🔻 Closed Short Position (USD/JPY)
| Detail | Value |
|---|---|
| Position | Short |
| Entry Price | 144.483 |
| Exit Price | 144.308 |
| P/L | +17.5 pips |
| Stop Loss | 145.183 (-70 pips) |
| Take Profit | 142.383 (+210 pips) |
| Strategy | Ama-chan’s 3-Time Daily Check Method |
| Exit Reason | Bullish candle closed above 9MA |
🎙️ Comment:
I closed the short trade without hesitation and opened a long immediately, just as the method dictates.Still, I’d be lying if I said I wasn’t a little disappointed—this short position had once shown over +170 pips in unrealized gains.
But that’s the tradeoff of an expectancy-based system: you give up the illusion of perfect exits in exchange for emotional consistency and structure. For me, that’s a trade worth making.
🔺 New Long Entry (USD/JPY)
| Detail | Value |
|---|---|
| Position | Long |
| Entry Price | 144.306 |
| Stop Loss | 143.606 (-70 pips) |
| Take Profit | 146.406 (+210 pips) |
| Strategy | Ama-chan’s 3-Time Daily Check Method |
| Entry Reason | Bullish candle closed above 9MA |
📈 Chapter 4: PnL Tracking – Ama-chan’s Method in Action
The Ama-chan 3-Time Daily Check Method emphasizes rule-based consistency over emotional reaction. Each trade follows a structured setup, with a fixed risk-reward ratio and predefined SL/TP parameters.
As of June 13, 2025, here is the performance summary of the demo trades taken under this system:
| Metric | Result |
|---|---|
| Total Trades | 5 |
| Wins | 2 |
| Losses | 3 |
| Net PnL | -24.7 pips |
| Current Position | Long |
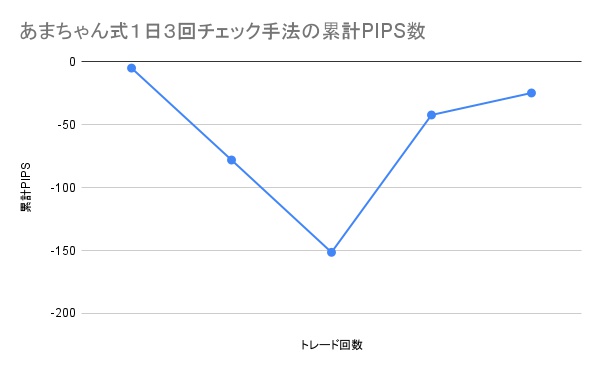
A cumulative PIPS tracking chart is maintained and updated with each trade. Although the current result shows more losses than wins, this is not unexpected. The system is designed around the principle of positive expectancy, where:
- Win rate can be low (e.g., ~30%)
- But risk-reward ratio (1:3 or better) ensures long-term profitability
Today’s floating gain of around +100 pips suggests that just one winning trade can potentially recover multiple small losses and put the system back into positive territory.
🧭 Summary & Reflections
Trading from the imaginary saddle of a camel in the Moroccan desert, today’s journal reminds me of an important truth: uncertain markets test our patience more than our predictions.
The USD/JPY pair showed no clear directional conviction, whipsawing between dollar strength and yen buying pressure after the U.S. data. Yet, the Ama-chan Method—with its focus on the 9MA structure and disciplined check-ins—helped avoid knee-jerk decisions.
Though the system currently reflects a net loss of -42.2 pips, the ongoing short trade is a potential turnaround. The method is not about winning every time, but about staying consistent and letting the math work out over time.
If anything, today’s market behavior reinforced this belief:
🌍 Even in choppy markets—or while dreaming of sunset rides through the Sahara—the edge lies in following your system, not your emotions.
Let’s see what the next chart check brings!