
At 5:55 AM on June 4, I powered up my PC and opened MT5.
As I checked the charts, the USD/JPY candle was clearly pushing above the 9-period moving average (9MA), forming what looked to be a strong bullish close.
At that moment, it became clear that the short position would need to be closed.
After entry, the trade had reached a maximum unrealized profit of over 160 pips.
However, the price found support near 142.364 and began to climb.
Eventually, the short was closed near breakeven.
Unfortunately, this exit occurred just after the New York session closed,
resulting in a widened spread of over 20 pips at the time of the close.
Immediately after, a bullish candle closed above the 9MA — a clear signal under my strategy.
So, following the rules, I entered a long position without hesitation.
Looking at the weekly chart, there are signs of a potential double bottom forming,
suggesting the possibility of a larger trend reversal ahead.
What kind of outcome will this trade deliver?
Let’s continue tracking the setup through the Ama-chan’s 3-Times-a-Day Check Strategy.
✅ Trade Position Summary (as of June 4, 2025 – 06:00 JST)
🔻 Closed Short Position
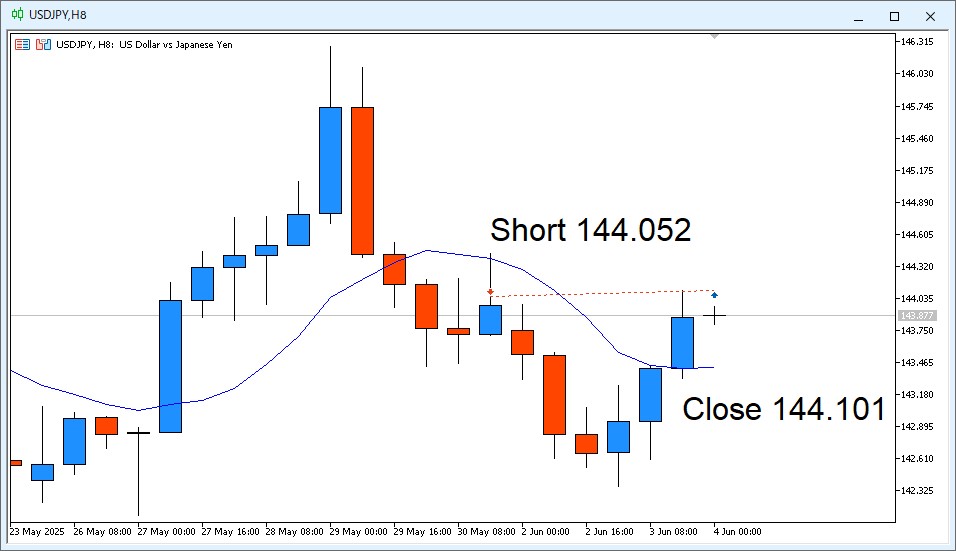
- Pair: USD/JPY
- Timeframe: 8H
- Position: Short
- Entry Price: 144.052
- Stop Loss: 144.752
- Take Profit: 141.952
- Lot Size: 0.01 (Demo)
- Exit Price: 144.101
- Exit Reason: Bullish candle closed above 9MA
- Strategy: Ama-chan’s 3-Times-a-Day Check Method
🔺 New Long Position
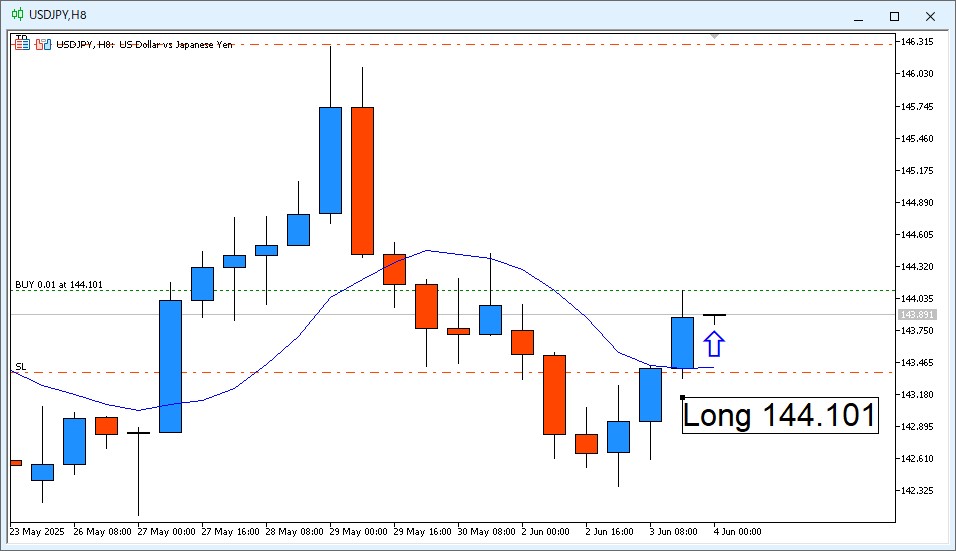
- Pair: USD/JPY
- Timeframe: 8H
- Position: Long
- Entry Price: 144.101
- Stop Loss: 143.371
- Take Profit: 146.291
- Lot Size: 0.01 (Demo)
- Entry Reason: Bullish candle confirmed above 9MA
- Strategy: Ama-chan’s 3-Times-a-Day Check Method
⚙️ Risk-Reward Settings
The risk-reward ratio remains at 1:3.
Based on the 13-week average range exceeding 370 pips,
- Stop loss was set at 73 pips
- Take profit at 219 pips
These levels were adjusted to reflect 60% of the average range.
🕕 06:00 Check (June 4, 2025)
- Candle Close: Bullish
- 9MA Status: Clearly broken to the upside
- Decision: Go long
💭 Trader’s Note (07:00 JST)
I closed the short and entered long right after the candle closed above the 9MA.
The spread widened sharply — over 20 pips — right after the NY session ended, making it a tough fill.
In hindsight, I realized that if I had entered the long just a few minutes later, the price would have been more favorable.
It’s frustrating, but I’m committed to following the rules — that’s the nature of this system.
Let’s see how this trade plays out.
Continuing with discipline under the Ama-chan Method.
🕑 14:00 Check – June 4, 2025
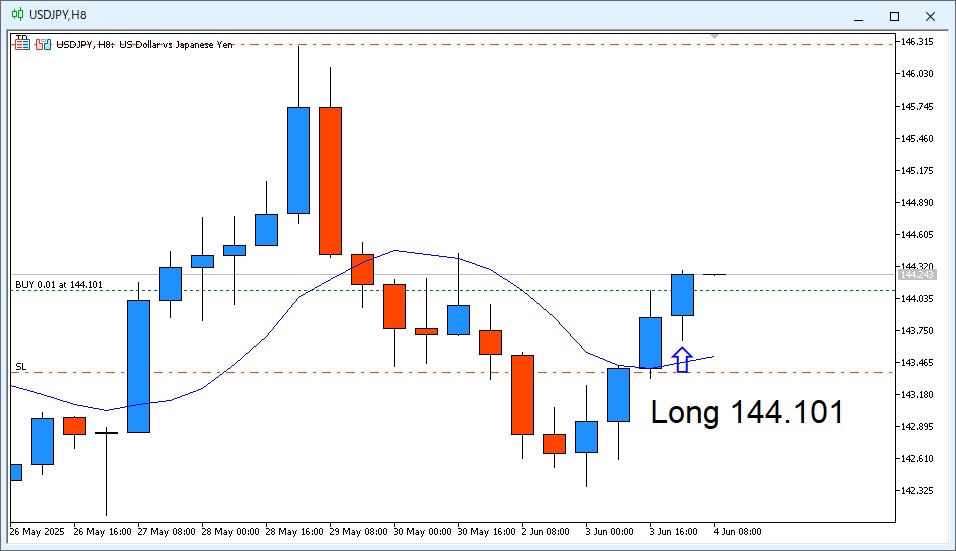
Candle Close Status: Bullish candle confirmed
Price vs. 9MA: Price is holding above the 9MA
Decision: Continue to hold the long position
Sentiment: Feeling relieved as the price has moved back above the entry. Now, it’s just a matter of waiting for the take-profit to be reached.
🕙 22:00 Check – June 4, 2025
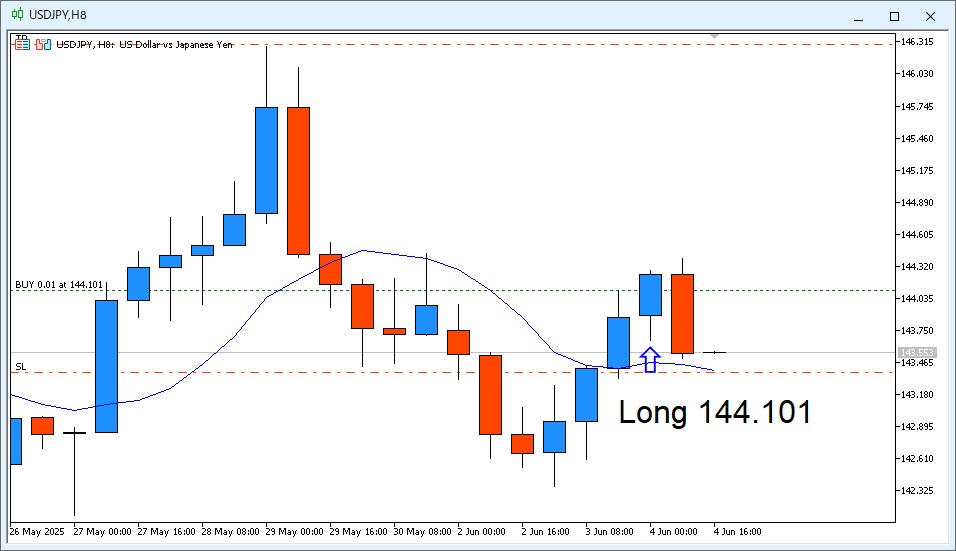
- Candle Confirmation: Bearish candle closed
- Price vs 9MA: Still holding above the 9MA
- Decision: Continue holding the long
- Sentiment:
A bearish engulfing pattern suggests downside pressure, but price hasn’t broken below the 9MA. Stop-loss might get triggered overnight. Depending on the 6:00 check tomorrow, I may consider a short entry. If price holds above the 9MA, I’ll stay long.
🔄 Daily Review
Executed the Ama-chan Style: 3 Checks a Day strategy by reviewing at 6:00, 14:00, and 22:00.
No take-profit or stop-loss was hit—still holding the position as of now.
Although four consecutive bullish candles had formed, the latest is a bearish engulfing.
There’s a real risk of stop-loss getting hit overnight.
Plan for the next 6:00 check:
- If price breaks below the 9MA → switch to short
- If it stays above → continue holding long