Curious about how hedge funds are positioning in the forex market?
Want to understand what really drives currency trends beyond charts and indicators?
This guide will show you how to decode the COT (Commitments of Traders) report like a pro—
and use it to improve your FX strategies, especially for USD/JPY.
Whether you’re a swing trader or macro-focused analyst, this article will help you read the market from the inside out.
Why COT Reports Matter to FX Traders
Uncovering the Positioning Behind the Charts
“You don’t trade the news—you trade how the market reacts to it.”
This phrase hits home for many traders who have realized that price movements are not just about headlines, but about positioning. In the forex market, it’s not only interest rates, central bank announcements, or macro data that drive price—it’s the behavior of large market participants.
What if you could visualize where the “big money” is placing their bets?
That’s exactly what the COT Report (Commitments of Traders Report) helps you do.
📊 What the COT Report Tells You
- Are hedge funds buying or selling a currency?
- Are their long positions overextended?
- Is there a risk of a reversal based on positioning extremes?
For swing traders and mid-term investors, the COT report offers a rare window into the sentiment of non-commercial traders—the speculators who often drive market trends.
🎯 What You’ll Learn in This Guide
This article is designed for traders who are new to the COT report but want to add a deeper layer of market analysis to their trading toolbox. We’ll cover:
- The structure and logic of the COT Report
- How to interpret the positioning of hedge funds (non-commercials)
- Visual examples using the Japanese Yen (USD/JPY) COT chart
- How to integrate COT data into your trading plan
Whether you’re new to sentiment analysis or looking for a smarter way to anticipate price moves, this guide will help you read the market from the inside out.
Let’s dive in and learn how to see what the big players are doing—before the chart even shows it.
What Is the COT Report and How Is It Structured?
A Weekly Window into Institutional Sentiment
The COT Report (Commitments of Traders Report) is a weekly publication by the U.S. Commodity Futures Trading Commission (CFTC) that reveals how different groups of traders are positioned in the futures markets.
It doesn’t predict price directly—but it shows you who is betting which way. For forex traders, this is a powerful way to read the “market behind the market.”
🕒 When Is the COT Report Released?
| Item | Details |
|---|---|
| Data Collection Day | Every Tuesday |
| Report Release Day | Every Friday (U.S. time) |
| Time Lag | ~3 days (still useful for swing trades) |
So, while it’s not a real-time indicator, it provides a big-picture view of market positioning, which is extremely useful for position traders, swing traders, and macro-focused analysts.
📋 What’s Inside the Report?
The COT report breaks down futures positions into categories of traders:
▶ Legacy Format (Most commonly used in Forex)
| Category | Description |
|---|---|
| Non-Commercial | Hedge funds, CTA, large speculators aiming to profit from price moves. These are the key players to watch. |
| Commercial | Corporations, banks, or exporters using futures for hedging—not for profit. Often take the other side of the trade. |
| Non-Reportable | Small traders whose positions are too small to report individually. Often retail traders. |
💡 For most forex traders, the Legacy Format is the most practical starting point. It’s simple, clear, and supported by many third-party charting tools (like Tradingster.com).
🔍 Example: JPY Futures on the CME (Code: 097741)
In the Legacy report, you’ll see figures like:
- Long = number of contracts betting price will rise (e.g., Yen will strengthen)
- Short = number of contracts betting price will fall
- Spreads = market-neutral positions (often ignored in FX analysis)
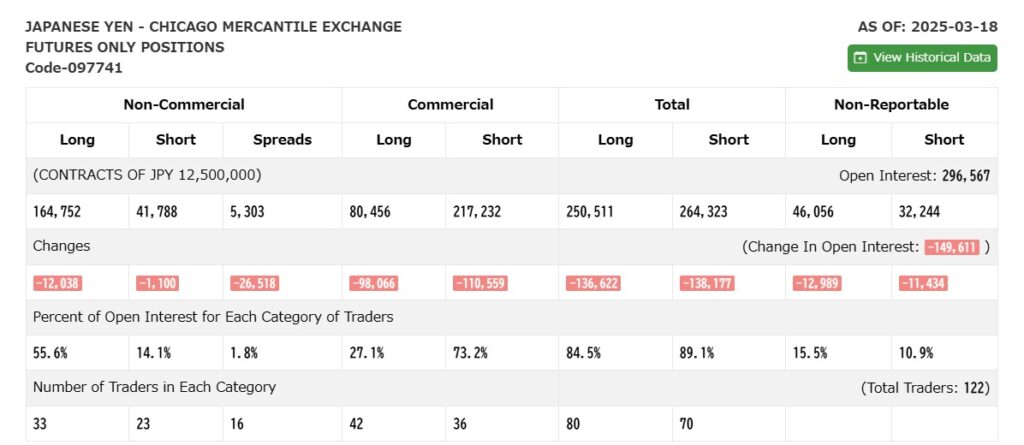
Under each, you’ll find the weekly change in position—this shows momentum and potential sentiment shifts.
📌 Example from the March 18, 2025 Report:
Non-Commercials: 164,752 Long vs. 41,788 Short → Net Long = +122,964
This tells us:
Hedge funds are heavily positioned for JPY strength (i.e., USD/JPY weakness).
In the next chapter, we’ll break down how to interpret these numbers in practice—
Which categories matter most? How do net positions signal potential reversals or trend continuation?
👉 Continue to [Chapter 3: Who to Watch? Understanding Each Category and Net Positioning]
Who to Watch?
Understanding Each Category and Net Positioning in the COT Report
The COT Report contains a wealth of data—but not all of it is equally important for FX traders.
If you’re wondering “Whose positions should I care about?”, the answer is simple:
👉 Follow the speculators.
🧠 Why Non-Commercials Matter Most
In the Legacy format, traders are categorized as:
| Category | Role in the Market | Relevance for FX Traders |
|---|---|---|
| Non-Commercial | Large speculators like hedge funds and CTAs. They trade for profit. | ✅ Very important |
| Commercial | Corporations and institutions hedging currency exposure. | 🔄 May counter trend |
| Non-Reportable | Retail traders or small speculators. | ❗Limited impact |
Non-Commercials are the “smart money” that often lead trends.
They take directional bets and adjust based on macro shifts, market sentiment, and positioning risks.
📈 Key Data Points: Long, Short, Net Position
▶ Long = Number of contracts betting on price increase
For JPY futures, a long position = expecting JPY to strengthen (i.e., USD/JPY to fall)
▶ Short = Number of contracts betting on price decrease
A short JPY position = expecting JPY to weaken (i.e., USD/JPY to rise)
▶ Net Position = Long – Short
This is the most important single metric in the COT Report for FX traders.
✅ Example (March 18, 2025):
- Non-Commercial Longs: 164,752
- Non-Commercial Shorts: 41,788
- Net Position: +122,964 → JPY Buy Bias
This means:
Speculators are heavily net long on JPY, signaling a bearish bias on USD/JPY.
🔁 Changes Column: Momentum of Positioning
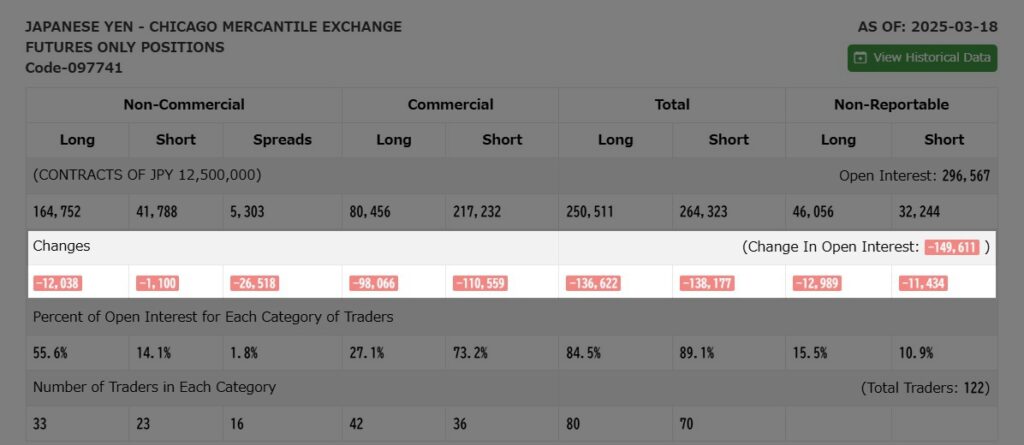
Beneath the position numbers, the Changes row shows how much each figure moved from the previous week.
| Position Type | Change (Mar 18, 2025) | Interpretation |
|---|---|---|
| Long | −12,038 | Profit-taking or fading bullish bias |
| Short | −1,100 | Slight short-covering |
Even if net long remains high, a drop in long positions could signal that momentum is slowing.
🧭 Quick Interpretation Guide
| Situation | Market Insight | Actionable Signal |
|---|---|---|
| Net Position rising consistently | Trend strengthening | Trend-following setups |
| Net Position at extreme highs | Crowded trade → risk of reversal | Consider contrarian positioning |
| Longs dropping sharply | Sentiment shift or profit-taking | Watch for breakdown or retrace |
| Shorts rising rapidly | Growing bearish conviction | Look for confirmation via chart |
In the next chapter, we’ll bring these numbers to life by analyzing them on actual COT charts, so you can learn to spot market pressure visually.
👉 Continue to [Chapter 4: Visualizing the COT: How to Read the Charts Effectively]
Visualizing the COT
How to Read the Charts Effectively
The raw numbers in the COT report are powerful—but they can be even more insightful when visualized.
COT charts allow you to spot patterns, momentum shifts, and positioning extremes much faster than by reading tables alone.
In this chapter, we’ll break down the most useful chart types using real data from the Japanese Yen (JPY) futures market.
⚔️ Long vs. Short: See the Battle of Buyers and Sellers
📊 Chart: Long vs. Short Positions by Trader Category
This bar chart shows how each group—Non-Commercial, Commercial, and Non-Reportable—is positioned:
- 🟦 Green bars: Long positions
- 🟥 Red bars: Short positions
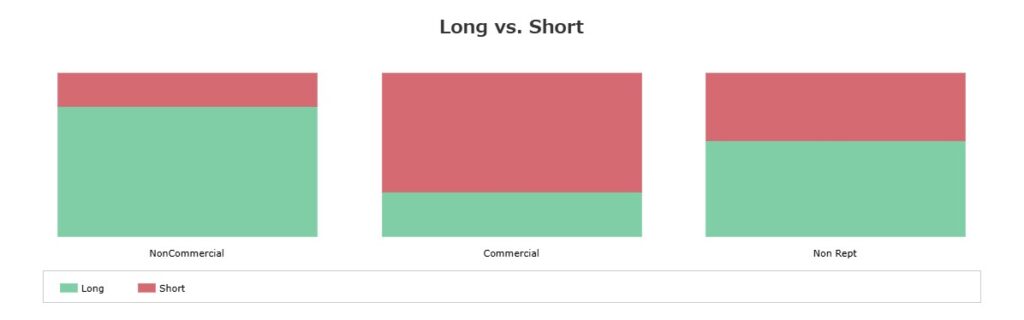
▶ Example Insights (March 2025):
- Non-Commercials (speculators) are heavily long JPY → They expect USD/JPY to fall
- Commercials are net short → likely hedging against potential JPY strength
- Retail traders (non-reportable) show a mixed and less decisive stance
Why it matters:
This chart quickly shows who’s dominant in the market, and in what direction they are leaning.
📉 Net Position vs. Price: Catch Trend Shifts Early
📈 Chart: Net Positioning + Price Overlay
This dual-axis chart combines:
- A line chart of JPY futures prices
- A bar or line showing Net Positions for each trader category
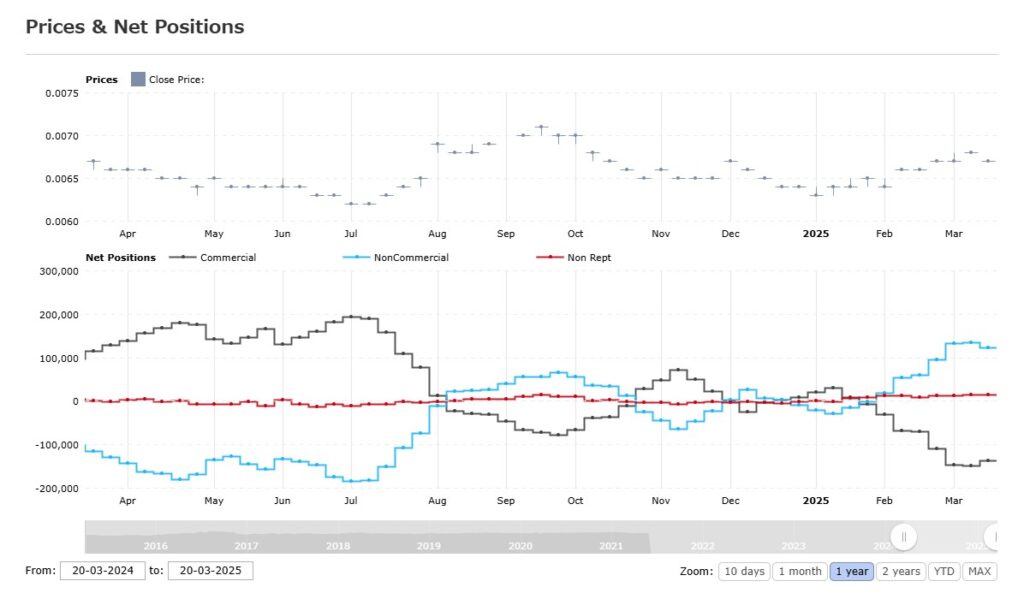
▶ What to look for:
- Rising net long positions → bullish sentiment building
- Divergence between price and net positions → potential trend reversal
📌 Real Example:
In late 2024, JPY net positions flipped from net short to strongly net long before price action caught up—a powerful early signal of USD/JPY downside.
Pro tip: COT data often moves before price—watch net positioning as a leading indicator.
📊 Long/Short Breakdown Over Time: Who’s Gaining Control?
📊 Chart: Long Positions by Category
📊 Chart: Short Positions by Category
These stacked charts show how much of the market’s long/short positioning is held by each group (Non-Commercial, Commercial, Non-Reportable).
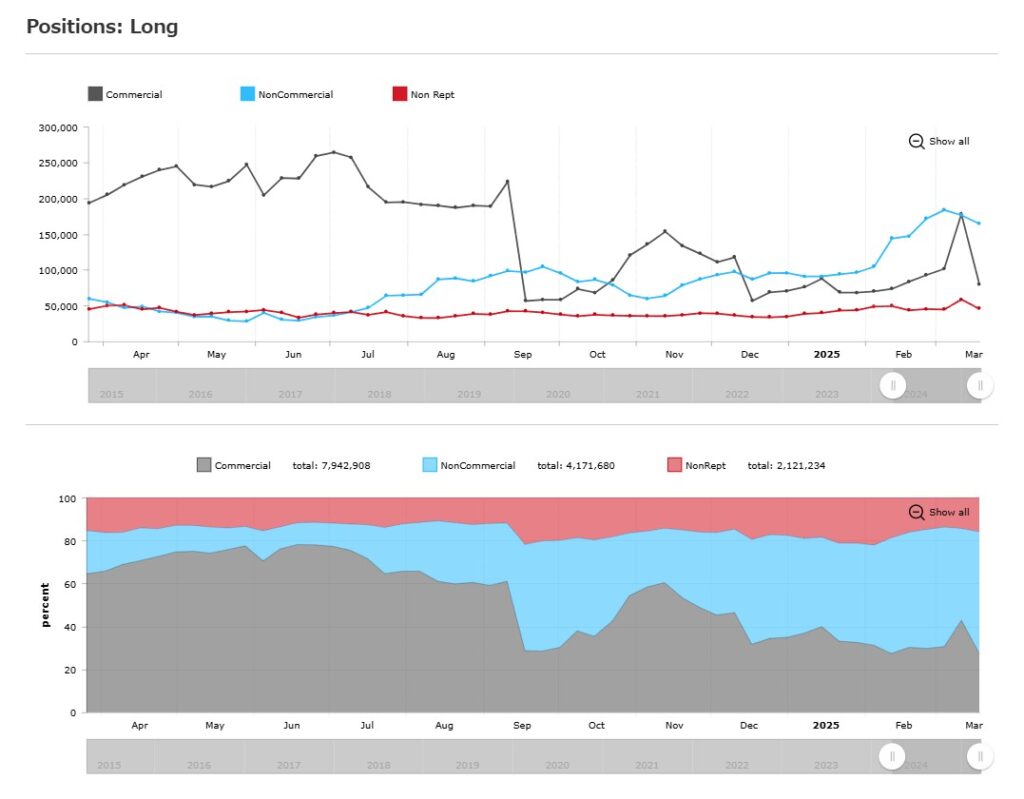
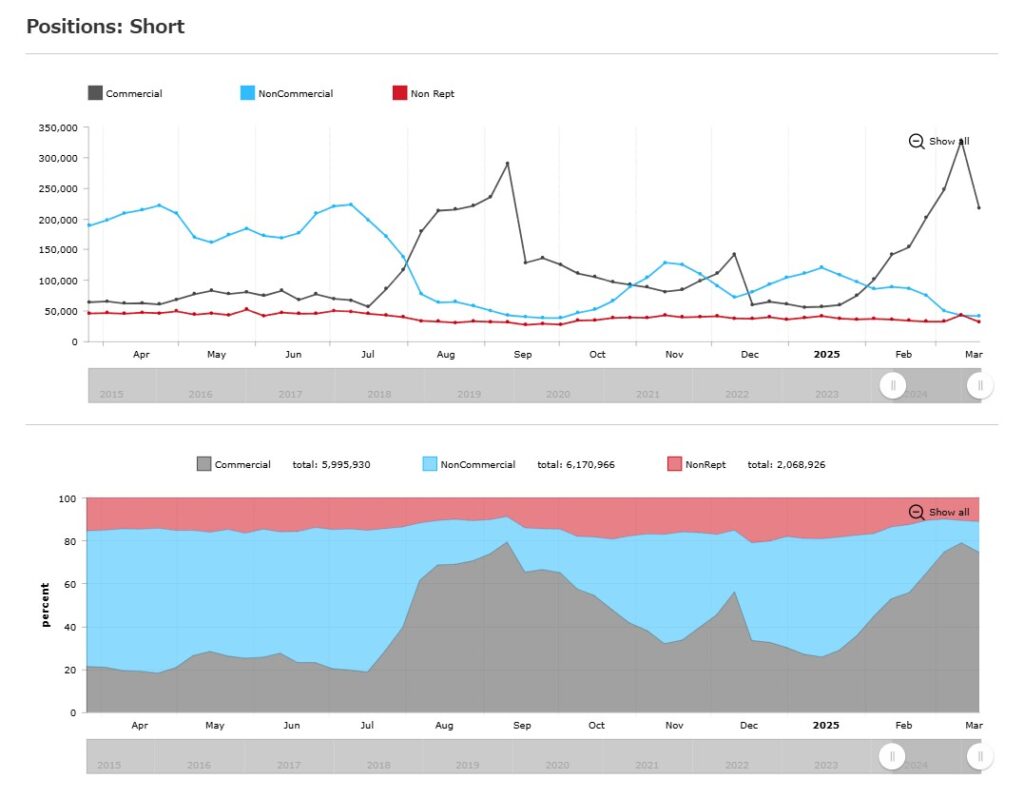
▶ Key insights:
- If speculators’ share of long positions is rising, they are gaining influence in the market
- If Commercials dominate the shorts, they may be absorbing risk as trend pressure builds
🧭 Example (2024–2025):
- Non-Commercials gradually increased their share of long JPY positions → indicating stronger conviction
- Commercials held most short positions → likely hedging, not trend-chasing
Why it matters:
Watching the change in leadership over time reveals when trends are maturing—or shifting.
🧠 Recap: What Each Chart Type Reveals
| Chart Type | What It Shows | Why It’s Useful |
|---|---|---|
| Long vs. Short (bar) | Positioning balance by group | Who is dominant: bulls or bears? |
| Net Position + Price | Trend strength, early shifts | Detect divergences or momentum fades |
| Position Breakdown (stacked) | Who holds the power over time | Spot trend leaders and transitions |
In the next chapter, we’ll take this analysis to the next level—
How do you use this information in your trading strategy?
We’ll walk through real-world use cases and entry/exit logic.
👉 Continue to [Chapter 5: How to Use the COT Report in Your Trading Strategy]
How to Use the COT Report in Your Trading Strategy
Turning Positioning Data into Actionable Trade Ideas
Now that you know how to read and interpret COT data, the next question is:
“How do I actually use this to improve my trades?”
The COT report won’t give you entry signals like a moving average crossover might.
Instead, it adds context—a deeper layer of understanding that helps you:
- Filter trade setups
- Confirm or question trends
- Anticipate potential reversals
- Manage risk with greater confidence
🧭 Step-by-Step COT Integration
▶ Step 1: Check Net Position and Momentum
Start with the Net Position of non-commercial traders.
- If net long is rising → bullish sentiment is building
- If net long is at extreme highs → watch for overbought conditions or reversal signals
- If net long is dropping fast → profit-taking or a shift in bias
🔍 Watch the “Changes” row in the COT data for momentum shifts.
▶ Step 2: Compare with the Chart
Overlay your COT insights with:
- Price action
- Trend structure (higher highs/lows or lower highs/lows)
- RSI/MACD or other momentum tools
✅ Example:
- COT shows hedge funds are trimming JPY longs
- RSI on USD/JPY is rising from oversold
- Price is breaking above resistance
🧠 Interpretation: Bullish reversal may be underway → look for long setups in USD/JPY
▶ Step 3: Define Scenarios
Use COT data to create scenarios, not fixed predictions.
| COT Behavior | Chart Confirmation | Strategy |
|---|---|---|
| Net Long expanding | Bullish price action | Trend-following long |
| Net Long extreme + flattening | Divergence or loss of momentum | Exit, tighten stops |
| Sharp drop in Net Long | Breakdown patterns | Reversal setup, short |
💡 Pro Tip: Combine COT with Sentiment & Fundamental Data
COT is most powerful when used alongside:
- Central bank commentary
- Interest rate expectations
- Economic calendar releases
- Retail positioning (e.g., via IG Client Sentiment)
This gives you a multi-layered perspective:
“What is the market expecting?” vs. “What are big players actually doing?”
🎯 Use Case: Trading USD/JPY with COT Insight
Let’s say:
- COT shows hedge funds are increasingly long JPY → bearish for USD/JPY
- Price is in a downtrend with lower highs and lower lows
- Retail traders are net long USD/JPY (contrarian signal)
✅ You now have fundamental, technical, and positioning alignment.
This is your high-conviction trade zone.
🧠 Final Thought: COT is a Strategic Tool
Think of COT data like a strategic map, not a trigger.
It won’t tell you where to enter to the pip, but it will tell you:
- Which side of the market to be on
- How confident the big players are
- When to be cautious or aggressive
Use it to filter noise, not chase every move.
Next up, we’ll bring it all together in a summary chapter—with key takeaways, best practices, and links to tools for monitoring COT data weekly.
👉 Continue to [Chapter 6: Summary – Mastering the COT Report for Smarter FX Trading]
Summary
Mastering the COT Report for Smarter FX Trading
By now, you’ve learned how to read the COT report, interpret positioning shifts, visualize the data, and apply it directly to your forex trading—especially for USD/JPY.
Let’s wrap up with key takeaways and best practices to make COT a consistent part of your strategy.
✅ Key Takeaways
| Insight | Why It Matters |
|---|---|
| COT shows what big players are doing | It reveals the sentiment and conviction of hedge funds, not just chart patterns. |
| Non-Commercials lead trends | These speculators tend to drive medium-term moves—follow their net positions. |
| Extreme positioning = potential reversal | When positioning gets too one-sided, expect volatility or trend exhaustion. |
| Changes reveal momentum | Weekly changes in positions can signal early shifts in sentiment before price reacts. |
| Visualizing helps spot pressure points | Charts make it easier to read who’s gaining or losing control of the market. |
🧰 Best Practices for Using COT
- Check COT Weekly (Saturday morning JST / Friday US time)
→ Make it part of your weekend analysis routine. - Focus on the Legacy Format for FX
→ It’s simple, clean, and widely supported. - Use COT with other tools
→ Combine it with trendlines, moving averages, RSI, and fundamental analysis. - Don’t use it for scalping or intraday
→ It’s a slow-moving, high-level sentiment gauge—best for swing to position trades. - Track it over time
→ Patterns emerge when you consistently monitor how sentiment shifts week to week.
🔗 Tools to Monitor COT Weekly
📈 Final Message to Traders
COT data won’t give you magical entry points. But it does something better—it gives you the “why” behind the market, showing what truly drives major moves.
By mastering the COT report, you shift from reactive trading to strategic, sentiment-driven decision-making.
If you’re serious about improving your edge in forex, especially in pairs like USD/JPY,
→ Make COT analysis part of your routine.
It’s one of the few tools that lets you see what the pros are doing—before the rest of the market reacts.
🔚 Thank you for reading!
If you found this guide helpful, feel free to share it or bookmark it for your weekly prep.
Let’s trade smarter—together.