
In most market environments, Bitcoin (BTC) and the U.S. Dollar Index (DXY) tend to move in opposite directions. A strong dollar usually signals risk-off sentiment, pushing BTC lower, while a weaker dollar often leads to BTC rallies under risk-on conditions.
But in March 2025, that pattern broke.
BTC and DXY moved in sync—both falling and then recovering around the same time. For FX traders, this rare alignment isn’t just a chart anomaly—it’s a reflection of shifting market sentiment, positioning, and macro uncertainty.
In this article, we’ll analyze how this unusual correlation unfolded, why it matters for USD/JPY traders, and what it could mean ahead of key events like the ISM Manufacturing PMI.
- ✅ Key Takeaways (Bullet List)
- 🔄 BTC and DXY: Typically Inverse, Not Synchronized
- ⚠️ March 2025: An Unexpected Positive Correlation
- 🧠 What Broke the Inverse Link Between BTC and the Dollar?
- 🎯 Implications for FX Traders: What to Watch and Why
- 📅 Key Events Ahead: Watching ISM and Sentiment Trends
- ✅ Summary: When Correlation Shifts Signal Market Stress
✅ Key Takeaways (Bullet List)
- 🔄 BTC and DXY normally show inverse correlation due to risk sentiment and dollar strength.
- ⚠️ In March 2025, both assets moved in the same direction, reflecting unusual market dynamics.
- 🧠 The shift may stem from position unwinding, macro uncertainty, and event-driven hesitation.
- 🎯 FX traders can use BTC-DXY correlation breakdowns to gauge sentiment and potential reversals.
- 📅 Upcoming data like ISM PMI may restore inverse correlation—or further disrupt it.
🔄 BTC and DXY: Typically Inverse, Not Synchronized
Bitcoin (BTC) and the U.S. Dollar Index (DXY) are usually seen as opposites on the risk spectrum. BTC is often considered a risk-on asset, rising when market sentiment is optimistic. In contrast, DXY reflects the relative strength of the U.S. dollar against a basket of major currencies—typically gaining when risk appetite fades and traders seek safety in USD.
This inverse correlation has made BTC a useful sentiment gauge for FX traders. When the dollar strengthens, BTC tends to weaken—and vice versa. But what happens when that correlation breaks?
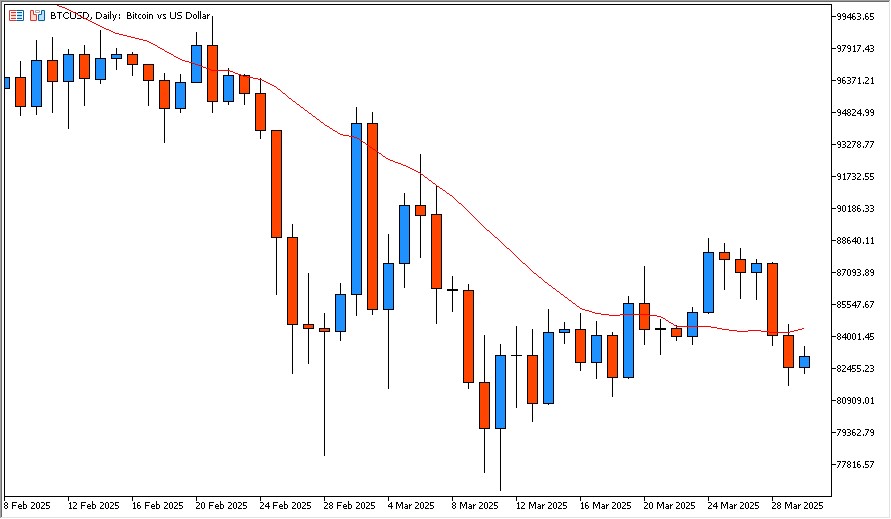
Price remains under the 20-day SMA, with limited rebound strength before resuming its downward trend.
⚠️ March 2025: An Unexpected Positive Correlation
In March 2025, BTC and DXY started moving in the same direction. From mid-February to mid-March, both assets trended downward. Then, they both rebounded around March 20 before facing renewed resistance near their respective 20-day moving averages.
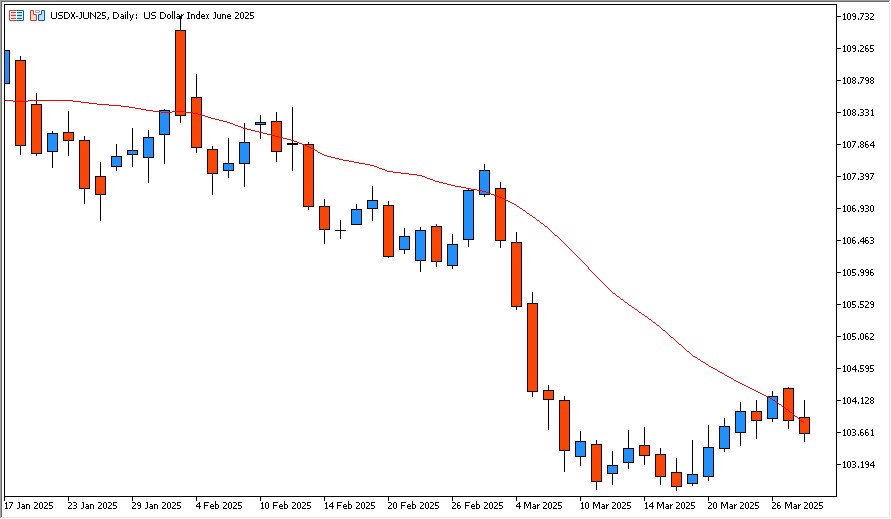
Like BTC, DXY attempted to recover in mid-March but faced resistance at the 20-day SMA and continued to slide.
This unusual synchronicity caught the attention of macro-focused traders. Instead of reflecting clear risk-on or risk-off conditions, the market showed signs of indecision, hedging, and capital reallocation across asset classes.
When BTC and DXY rise and fall together, it often signals a market in flux—where traders are pulling capital from both risk and safe-haven assets, unsure of which narrative will dominate.
🧠 What Broke the Inverse Link Between BTC and the Dollar?
There are several plausible explanations for this temporary correlation breakdown:
- Pre-event positioning: March featured major economic releases, including the FOMC meeting and PCE inflation data. Traders often de-risk across the board before such events, causing synchronized moves.
- Macro uncertainty: Mixed signals from inflation, employment, and Fed commentary made it difficult to interpret the market narrative. As a result, traditional correlations weakened.
- Position unwinding: Profit-taking or stop-hunting in both BTC and USD assets may have triggered parallel technical moves, especially among leveraged traders.
This alignment wasn’t about fundamentals—it was about sentiment confusion.
🎯 Implications for FX Traders: What to Watch and Why
For FX traders, especially those focused on USD/JPY, the BTC–DXY relationship can offer early clues about sentiment shifts:
- Correlation shifts often precede volatility events. If BTC and DXY suddenly move together, it may hint at market-wide rebalancing or systemic stress.
- Reconfirmation of inverse correlation after a breakdown can serve as a trade signal—especially near major events or technical levels.
- BTC as a leading sentiment gauge becomes especially valuable in uncertain conditions when traditional indicators conflict.
Watching BTC/DXY behavior side by side gives traders a “second opinion” on USD strength beyond traditional FX pairs.
📅 Key Events Ahead: Watching ISM and Sentiment Trends
The next potential inflection point is the ISM Manufacturing PMI, scheduled for April 1, 2025. If the index surprises to the upside, the dollar may regain strength—possibly restoring the inverse BTC–DXY relationship.
On the other hand, weak ISM data could further erode confidence in U.S. growth and deepen market confusion.
Either way, tracking whether BTC and DXY realign or continue to sync will help FX traders understand whether risk-on/off sentiment is strengthening or breaking down.
✅ Summary: When Correlation Shifts Signal Market Stress
March 2025’s synchronized movements between BTC and DXY weren’t just a statistical anomaly—they reflected deeper market stress and indecision.
For FX traders, this rare alignment serves as a reminder:
When traditional correlations break, there’s an opportunity to spot upcoming shifts—if you’re watching the right charts.
BTC may be a crypto asset, but its behavior increasingly offers value to currency traders who want a broader perspective on global capital flows.