🟦 Introduction
Are you tired of staring at charts all day, trying to catch every little market move—only to end up overtrading or missing the best setups?
The Ama-chan FX Method offers a refreshingly simple and structured way to trade:
Just check the USD/JPY chart three times a day and aim for 210 pips profit per week.
This method was created for those who want:
- A clear entry and exit system
- A high risk-reward ratio (1:3.5)
- A strategy that’s easy to follow and repeat
- And most importantly—a life beyond the charts
In this guide, I’ll show you how this method works, why it focuses on the 8-hour timeframe, and why USD/JPY is the ideal currency pair.
You’ll also see real trade results and learn whether this style fits your lifestyle and trading goals.
Let’s get started.
- 🟦 Chapter 1: The Concept Behind the “3-Check” FX Strategy
- 🟦 Chapter 2: What You Need – Timeframe, Indicators & Frequency
- 🟦 Chapter 3: Entry and Exit Rules – Clear and Simple
- 🟦 Chapter 4: Why USD/JPY Is the Ideal Pair for This Strategy
- 🟦 Chapter 5: Performance, Proof, and Expectations
- 🟦 Chapter 6: Summary – Should You Try This Strategy?
- 🟦 Appendix: Live Trade Records (Updated)
🟦 Chapter 1: The Concept Behind the “3-Check” FX Strategy
🔹 Trade Less, Profit More
Most traders think they need to trade every day—or worse, multiple times per day—to be profitable. But in reality, more trades often lead to more mistakes, especially when emotion overrides logic.
The “3-Check” FX Strategy flips this mindset.
Instead of chasing pips all day long, you:
- Check the chart just 3 times a day (morning, midday, evening)
- Wait for a clear entry setup
- Enter only when conditions are met
- Set and forget with pre-defined TP and SL levels
No constant screen time. No emotional overreactions.
Just a simple, repeatable routine with asymmetric rewards: risk 60 pips to aim for 210.
🔹 Why Simplicity Wins in FX
This method is built on the idea that simplicity leads to consistency.
You don’t need a dozen indicators, complex algos, or live news feeds.
Just:
- One currency pair (USD/JPY)
- One chart (8-hour time frame)
- Two moving averages (9 and 36)
- A rule-based system that tells you exactly what to do
The result?
A strategy that can be followed by anyone, including part-time traders and beginners—with no need for discretionary judgment.
🔹 Who This Strategy Is For
This isn’t a high-frequency system or a scalping method.
It’s designed for people who:
- Have limited time but want to trade with an edge
- Prefer a clear structure and low-stress execution
- Value quality setups over quantity
- Want a strategy that feels more like a routine, not a gamble
If that sounds like you, the Ama-chan FX Method might be your perfect fit.
🟦 Chapter 2: What You Need – Timeframe, Indicators & Frequency
🔹 Why the 8-Hour Chart?
The 8-hour timeframe is the sweet spot between intraday noise and long-term indecision.
- It filters out market chop you’d often see on 1H or 4H charts
- It gives you enough time between candles to avoid overtrading
- It still offers frequent enough signals to generate opportunities each week
For this strategy, you only need to check the chart three times a day:
once every 8 hours—ideally around 6:00, 14:00, and 22:00 Japan time.
This schedule allows you to build a routine that fits into your life, not the other way around.
🔹 The Two Indicators: 9MA and 36MA
You’ll only need two moving averages:
- 9-period MA (9MA): captures the short-term trend over ~3 days on the 8H chart
- 36-period MA (36MA): reflects the mid-term trend (~12 days)
Their interaction defines the trend context for trade entries.
When the 9MA is above the 36MA, you’re looking for long setups.
When the 9MA is below the 36MA, you’re looking for short setups.
It’s clean. It’s rule-based. And most importantly—it’s easy to interpret.
🔹 The Daily Rhythm: 3 Simple Checks
Here’s how the rhythm works:
- Check the chart at 6:00, 14:00, and 22:00 (JST)
- Determine if the moving averages are in alignment (either bullish or bearish)
- Check if a valid signal candle has formed based on entry rules
- If yes, enter and place TP/SL
- Done. No need to monitor further
It takes less than 5 minutes per check.
That means you can trade with structure and discipline, even with a full-time job, school, or other responsibilities.
🟦 Chapter 3: Entry and Exit Rules – Clear and Simple
🔹 Long Entry Conditions
You take a buy position (long) when all the following are true:
- The 9MA is above the 36MA (bullish alignment)
- A candle closes above the 9MA after crossing from below
- You enter on the open of the next candle
This confirms that:
- The trend is up
- Momentum has resumed
- You’re entering on strength, not prediction
🔹 Short Entry Conditions
You take a sell position (short) when all the following are met:
- The 9MA is below the 36MA (bearish alignment)
- A candle closes below the 9MA after crossing from above
- You enter on the open of the next candle
This way, you’re aligned with the trend and catching momentum as it resumes downward.
🔹 TP and SL: Risk-Reward Built In
Once you enter, you immediately place a Take Profit (TP) and Stop Loss (SL):
- TP = 210 pips from entry
- SL = 60 pips from entry
- Risk-to-Reward Ratio = 1:3.5
This structure allows you to:
- Keep losses controlled
- Let winners run
- Maintain psychological discipline
- Avoid second-guessing your exits
📌 It’s a set-and-forget system.
No trailing stops. No partial exits. No discretionary tweaks.
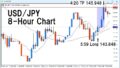
🔹 Example Trade Setup (Actual Trade)

Let’s look at a real example:
- Entry: May 8, 2025 – Buy USD/JPY at 143.848
- Exit: May 9, 2025 – TP hit at 145.948
- Pips gained: +210
- Rationale: 9MA was above 36MA, and the candle closed above 9MA from below
This exact rule-based entry led to a clean profit—no guesswork required.
🟦 Chapter 4: Why USD/JPY Is the Ideal Pair for This Strategy
Choosing the right currency pair is just as important as having a solid strategy.
The Ama-chan FX Method was designed with USD/JPY in mind—and for good reason.
🔹 Deep Liquidity = Seamless Execution
In trading, it’s critical to have someone on the other side of your trade.
You want to buy when someone’s selling, and sell when someone’s buying.
USD/JPY is one of the most liquid currency pairs in the world, traded heavily across all major sessions—Tokyo, London, and New York.
This ensures:
- Tight spreads, even during volatile hours
- Fast execution
- Low slippage, especially on major brokers
In short, you’re less likely to get stuck in a position because “nobody’s there” to fill your order.
🔹 Volatility That Actually Moves the Market
Different currency pairs have different average weekly ranges.
Here’s a recent 13-week average of pip movement:
| Pair | Weekly Range (avg) |
|---|---|
| USD/JPY | 361 pips |
| EUR/USD | 243 pips |
That means USD/JPY offers significantly more room to move, making it perfect for a strategy targeting 210-pip profits.
More volatility = more opportunity—without overtrading.
🔹 Still Want to Use EUR/USD? Adjust the Numbers.
This strategy can work on EUR/USD or other pairs.
However, you’d need to:
- Reduce your TP/SL levels
- Adjust your expectations for volatility
For example, on EUR/USD, you might aim for:
- TP: 140–160 pips
- SL: 40–50 pips
So if you’re trading with limited capital and prefer smaller stop losses, EUR/USD could be considered.
But unless you have a specific reason, USD/JPY remains the most efficient and reliable pair for this method.
🟦 Chapter 5: Performance, Proof, and Expectations
A strategy is only as good as its results.
Let’s look at the first real trade executed using the Ama-chan FX Method, and how performance will be tracked going forward.
🔹 First Real Trade: +210 Pips
On May 8, 2025, a long trade was placed on USD/JPY using the exact rules outlined in this guide.
Trade details:
- Entry: 143.848 (Buy)
- Exit: 145.948 (Take Profit hit)
- Pips gained: +210
- Lot size: 0.01
- Profit: ¥2,100
- Execution time: Entry at 5:59 JST, Exit at 4:20 JST next day
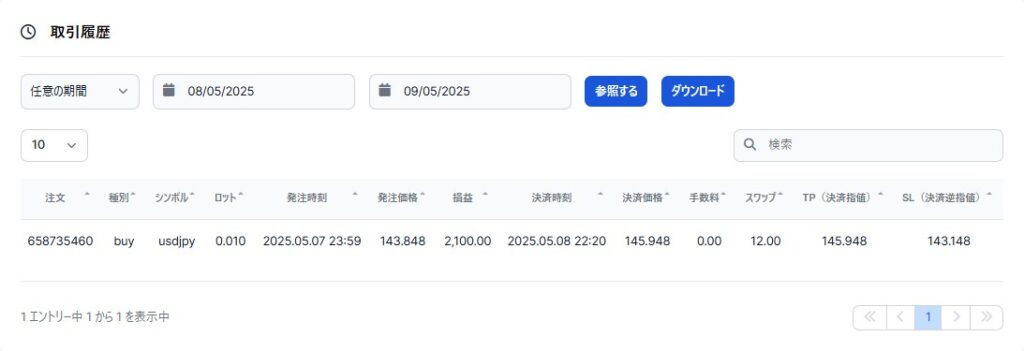
The trade was executed via XMTrading, and the full trade history was recorded, including:
- Chart with arrows marking entry and exit points
- MA lines for context
- Screenshot of the broker trade log
🔹 Full Proof: Trade Record Screenshot
This isn’t a theoretical backtest.
It’s a real-world trade, executed with a live broker under normal market conditions.
Here’s what’s included in the documentation:
- 8-hour USD/JPY chart with indicators and arrows
- Entry at 143.848 (marked with ↑)
- TP at 145.948 (marked with ↓)
- Stop-loss was set at 143.248 but never triggered
- Result: +210 pips gained exactly as planned
📸 A screenshot of the broker’s trade history confirms the entire flow.
🔹 What’s the Current Expectation?
So far:
- Trades executed: 1
- Wins: 1
- Losses: 0
- Total pips gained: +210
- Average pips per trade: +210
📌 Important note: This is still early-stage data.
One trade doesn’t define a strategy, but it does demonstrate its clarity, repeatability, and potential.
🔹 How Performance Will Be Tracked
Each new trade using this method will be logged publicly.
Future records will include:
- Date of entry
- Entry/exit prices
- Trade outcome (pips gained/lost)
- Trade screenshots and broker receipts
- Updates to running totals and win rate
A dedicated section in this guide will maintain live trade updates, so you can follow along and verify for yourself.
🟦 Chapter 6: Summary – Should You Try This Strategy?
The Ama-chan FX Method is not about chasing trades.
It’s about creating a repeatable, low-stress routine that fits your lifestyle while still aiming for strong returns.
Let’s break it down:
🔹 Who This Strategy Is Best Suited For
✅ Busy professionals
If you don’t have time to stare at charts all day but still want to trade with discipline, this method is for you.
✅ Beginners who want clarity
The rules are simple. You only need two moving averages, a chart you check three times a day, and a fixed TP/SL setup.
✅ Emotionally tired traders
If overtrading or decision fatigue has worn you out, this structured approach removes guesswork and resets your mindset.
✅ Swing traders who want more structure
You can stay in trades overnight and target larger moves without micromanaging every candle.
🔹 Final Checklist Before You Start
- ✅ Are you willing to follow rules without tweaking them every trade?
- ✅ Can you check the chart at 3 fixed times per day?
- ✅ Do you understand that not every week will have a trade, but the ones that come are worth the wait?
If so, this strategy might be your ideal setup.
🔹 What to Expect Next
This guide will be updated with live trade records, additional notes from experience, and even variations (e.g., for EUR/USD or 4H charts).
The next trade might come tomorrow. Or in a few days.
Either way, we’ll stick to the plan and let the method prove itself over time.
Want to follow along?
📌 Bookmark this guide, and check out the Live Trade Record section to stay up to date.
🟦 Appendix: Live Trade Records (Updated)
This section is dedicated to tracking all real trades executed using the Ama-chan FX Method.
Each record includes key data points, links to full trade breakdowns, and broker-verified screenshots.
✅ Trade Record: May 8, 2025
- Pair: USD/JPY
- Direction: Long
- Entry Time: 5:59 JST
- Entry Price: 143.848
- Exit Time: 4:20 JST (next day)
- Exit Price: 145.948
- Pips Gained: +210
- Result: ✅ Take-Profit hit
- Platform: XMTrading
🔗 View full trade breakdown and chart
📸 Includes chart with entry/exit arrows and a screenshot of the broker’s trade history.
🗓️ Coming Up Next
This list will grow as new trades are taken and published.
All trades will follow the exact same rules, with no discretionary intervention.
- Check back regularly
- Follow the evolving win rate and average pips
- See the method in action over time