- 🟦 Chapter 1: What Are Initial Jobless Claims?
- 🟦 Chapter 2: When and Where to Track the Weekly Data
- 🟦 Chapter 3: Why Rising or Falling Claims Matter for Markets
- 🟦 Chapter 4: How USD/JPY Reacts — FX Playbook Examples
- 🟦 Chapter 5: FAQ for Traders and Investors
- 🟦 Final Chapter: Key Takeaways and Strategy Tips for FX Traders
🟦 Chapter 1: What Are Initial Jobless Claims?
Initial Jobless Claims refer to the number of individuals who filed for unemployment benefits for the first time during a given week in the United States.
This data is published every Thursday by the U.S. Department of Labor, and it serves as a timely indicator of changes in the labor market.
Unlike monthly reports such as Non-Farm Payrolls (NFP) or the Unemployment Rate, this is a weekly, high-frequency economic indicator that offers early insight into the health of the U.S. economy.
🧠 Why Should Traders Care?
Because jobless claims often rise before broader economic weakness becomes visible, they act as a leading indicator.
In particular, FX traders monitor this number closely for early signs of:
- An economic slowdown (claims rising)
- A labor market recovery (claims falling)
The implications are direct:
📉 Higher claims → potential recession fears, Fed dovish shift, → USD weakening
📈 Lower claims → stronger labor market → Fed hawkish stance, → USD strengthening
📊 Not to Be Confused With Other Labor Data
| Indicator | Description | Frequency | Market Use |
|---|---|---|---|
| Initial Jobless Claims | New applicants for unemployment benefits | Weekly | Leading signal of labor market shifts |
| Unemployment Rate | % of jobless individuals in the labor force | Monthly | Broader, lagging indicator |
| Non-Farm Payrolls (NFP) | Net job creation in non-farming sectors | Monthly | Major driver of USD volatility |
📘 Quick Terminology Guide
- “Initial Claims” = New applications (not continued claims)
- Common abbreviations: Jobless Claims, Unemployment Claims, Weekly Claims
- Published by: U.S. Department of Labor
In short, Initial Jobless Claims offer early warning signals. They help traders stay ahead of economic trends and anticipate moves in key currency pairs like USD/JPY and EUR/USD.
🟦 Chapter 2: When and Where to Track the Weekly Data
🕒 Release Schedule
Initial Jobless Claims are released every Thursday at 8:30 a.m. Eastern Time by the U.S. Department of Labor.
This translates to:
- Japan Time (JST): 9:30 p.m. (during Daylight Saving Time)
- 10:30 p.m. (during Standard Time)
Because it’s a weekly release, this indicator is often the first major economic data of the week to reflect U.S. economic conditions.
📍 Where to Find It – Top Sources for Traders
Here are the most reliable platforms to check both the actual numbers and market reactions:
| Platform | Purpose | Notes |
|---|---|---|
| U.S. Department of Labor | Official release (PDF) | dol.gov |
| Investing.com | Economic calendar with forecasts & actuals | Easy-to-read, supports alerts |
| Bloomberg / Reuters | Real-time news coverage with market context | Professional tone, FX reactions |
| TradingView | Visualize USD/JPY or S&P 500 price reaction | Add economic events to chart timeline |
| Forexfactory.com | Popular among FX traders | Shows impact level and trader sentiment |
🔄 What to Watch For
Traders should monitor three key values:
- Actual: The released number (e.g., 225K)
- Forecast: Market consensus before the release (e.g., 215K)
- Previous (Revised): Last week’s number, sometimes revised
📌 Surprises matter most. The difference between the actual and forecast figure is what usually moves markets.
📈 Can You Chart It?
Yes. While Jobless Claims are a single weekly data point, platforms like TradingView allow you to:
- Overlay economic events on a USD/JPY chart
- Backtest price reactions over past months or years
- Combine with other indicators like NFP or CPI for context
⚠️ Watch the Market Conditions
The same number can trigger very different market reactions depending on the macro backdrop:
- In a rate-sensitive market, a drop in claims may boost USD
- In a risk-off market, a surprise increase may accelerate JPY strength
Understanding the context is just as important as watching the number itself.
🟦 Chapter 3: Why Rising or Falling Claims Matter for Markets
At first glance, a weekly report on unemployment claims might seem like a minor data point—but in reality, it often shifts sentiment across Forex, equities, and bonds.
📉 When Jobless Claims Rise (Worse-than-Expected)
Rising claims typically signal that:
- More people are losing jobs
- Labor market conditions are loosening
- Consumer confidence and spending may weaken
Market Interpretation:
| Market | Typical Reaction |
|---|---|
| USD | Weakens (due to lower rate expectations) |
| JPY | Strengthens (risk-off flows) |
| Stocks | Decline (growth concerns) |
| Bonds | Rally (yields fall as investors seek safety) |
🧠 Especially in rate-sensitive environments, traders interpret rising claims as a dovish signal for the Fed → leading to USD weakness.
📈 When Jobless Claims Fall (Better-than-Expected)
Declining claims suggest:
- A strong labor market
- Higher wage pressures (potentially inflationary)
- Confidence in consumer spending and business hiring
Market Interpretation:
| Market | Typical Reaction |
|---|---|
| USD | Strengthens (rate hike bias remains) |
| JPY | Weakens (risk-on flows) |
| Stocks | Rally (economic optimism) |
| Bonds | Decline (yields rise on inflation/fed fears) |
📌 In times when the Fed is concerned about inflation, strong labor data can delay rate cuts and support the dollar.
🧭 It’s All About Surprise vs. Expectation
Markets don’t just react to the number—they react to how it compares to expectations.
| Scenario | Possible Outcome |
|---|---|
| 🔺 Actual > Forecast | USD weakens (bad surprise) |
| 🔻 Actual < Forecast | USD strengthens (good surprise) |
| ➖ In line with Forecast | Muted market response |
In recent years, even a deviation of 10–20K from the forecast has triggered 30–50 pip moves in USD/JPY within minutes.
📊 Example Snapshot:
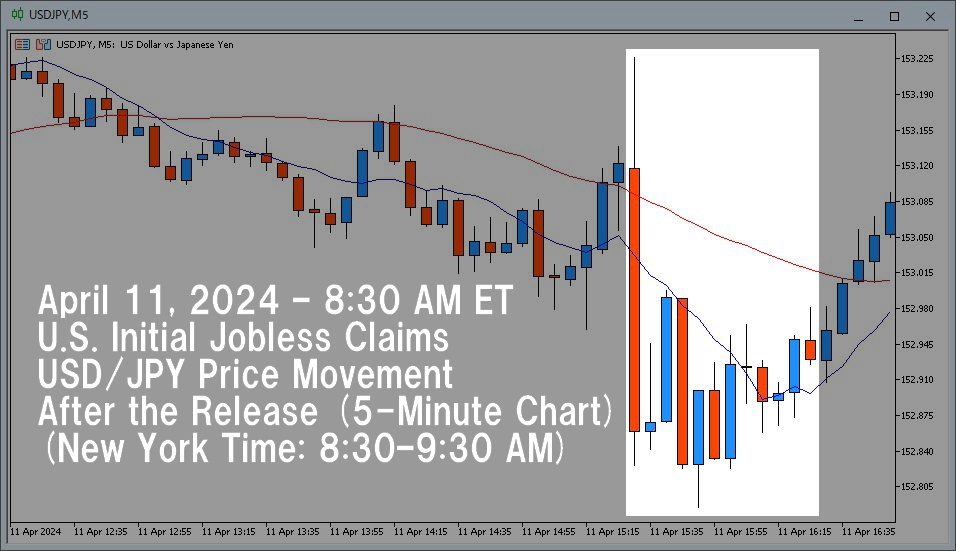
On April 11, 2024, U.S. Initial Jobless Claims came in at 211K,
beating the consensus forecast of 215K and down from the prior week’s revised 222K.
Markets viewed this as a sign of continued labor market strength.
🔍 USD/JPY Reaction (5-minute chart):
- Release time: 21:30 JST
- Open: 153.117
- High: 153.226
- Low: 152.826
- Close: 152.859
➡️ Price dropped nearly 30 pips in the first 5 minutes, despite the positive data.
💡 Interpretation:
While the headline number beat expectations, the sharp drop in USD/JPY suggests the market may have been:
- Focused on broader risk sentiment or positioning
- Pricing in profit-taking after prior dollar strength
- Reacting to other concurrent macro factors (e.g., bond yields or geopolitical news)
📌 Even “good news” can trigger short-term USD selling, especially if the market was already leaning heavily long on the dollar.
✅ Summary Takeaway
- Rising claims = potential economic slowdown → dovish Fed → USD softens
- Falling claims = labor strength → hawkish Fed or risk-on sentiment → USD strengthens
- Always compare the actual figure to the consensus forecast and consider the macro context before trading.
🟦 Chapter 4: How USD/JPY Reacts — FX Playbook Examples
The USD/JPY currency pair is highly sensitive to U.S. labor market data, especially Initial Jobless Claims.
Because this indicator impacts Fed policy expectations and risk sentiment, even a small surprise can trigger sharp moves — particularly in short-term trading.
📉 Reaction Mechanics: Why USD/JPY Moves
| Scenario | Market Interpretation | USD/JPY Reaction |
|---|---|---|
| 🔺 Higher-than-expected claims | Labor weakness → Fed may ease → Risk-off mood | 📉 USD/JPY falls (USD weakens, JPY strengthens) |
| 🔻 Lower-than-expected claims | Labor strength → Fed may stay hawkish → Risk-on mood | 📈 USD/JPY rises (USD strengthens, JPY weakens) |
But actual price action often depends on context, including:
- Overall market sentiment
- Upcoming major events (e.g. CPI, FOMC)
- Trader positioning and liquidity at release time
📊 Real-World Example: April 11, 2024
U.S. Initial Jobless Claims:
Actual: 211K
Forecast: 215K
Previous (revised): 222K
A positive surprise — claims fell more than expected.
But what happened in the market?
📉 USD/JPY (5-Minute Chart: 8:30–9:30 AM ET):
- Open: 153.117
- High: 153.226
- Low: 152.826
- Close: 152.859
➡️ A nearly 30-pip drop within minutes, despite stronger-than-expected data.
🎯 What This Means for Traders
This “paradoxical” move highlights a key lesson:
Market expectations aren’t everything — positioning and risk sentiment often dominate short-term price behavior.
📌 Possible reasons for the drop:
- Dollar was overbought heading into the release
- Traders took profit on long USD positions
- Broader macro flows (e.g., falling U.S. yields, geopolitical risk) overshadowed the headline
🛠️ Trading Playbook: How to Approach the Data
| Strategy | When to Use | Notes |
|---|---|---|
| Fade the Spike | If price overreacts to a minor beat/miss | Watch for exhaustion candles on 1- or 5-min charts |
| Breakout Follow-Through | If surprise is large AND confirmed by momentum | Use volume and RSI to confirm direction |
| Wait-and-See Mode | If data is in line with forecasts | Avoid forced trades in a directionless market |
✅ Key Takeaway
- USD/JPY doesn’t just move on numbers — it moves on surprise + context + flow
- Use economic data + technical setups + sentiment together to build trade ideas
- Always zoom out: one strong or weak print doesn’t change the trend alone
🟦 Chapter 5: FAQ for Traders and Investors
❓ What’s the difference between Initial Jobless Claims and the Unemployment Rate?
| Metric | Description | Frequency | Use Case |
|---|---|---|---|
| Initial Jobless Claims | Weekly number of new unemployment benefit applicants | Weekly | Short-term labor trend signal |
| Unemployment Rate | % of unemployed in the labor force | Monthly | Broad macro snapshot, lagging indicator |
🧠 Jobless Claims are leading, while the unemployment rate is more retrospective. Claims react faster to economic shifts.
❓ Do Jobless Claims directly predict Non-Farm Payrolls (NFP)?
Not precisely — but they offer useful context.
- Rising jobless claims may hint at soft NFP numbers to come
- Falling claims could support stronger payroll growth
- Best used in combination with 4-week average trends and other indicators (e.g. JOLTS, ADP)
📌 Traders often use claims as a “temperature check” in the weeks leading up to NFP.
❓ What is the 4-week moving average, and why does it matter?
The 4-week average smooths out weekly volatility caused by:
- Holidays
- Weather disruptions
- Temporary layoffs
✅ Markets pay attention to it because it reflects underlying labor trends more clearly than a single week’s data.
❓ Why do markets sometimes ignore a “good” or “bad” result?
Because:
- The result may already be priced in
- There’s a bigger event (like CPI or FOMC) looming
- Risk sentiment is dominating (e.g. equity selloffs, geopolitical risk)
- Positioning and flow matter more than data in the short term
🧠 Data is just one part of the puzzle — reaction > number.
❓ Who else follows Jobless Claims besides FX traders?
| Audience | Reason |
|---|---|
| 📊 Equity traders | Labor signals → corporate earnings impact |
| 🏦 Bond investors | Labor weakness → rate cuts → yields fall |
| 📰 Financial media | Easy-to-understand economic health check |
| 🎓 Students & researchers | Common in macroeconomic case studies |
✅ Summary
Understanding the mechanics and context behind jobless claims helps you:
- Avoid overreacting to noisy weekly prints
- Spot trend shifts before they hit the headlines
- Build confidence in short-term and swing FX setups
🟦 Final Chapter: Key Takeaways and Strategy Tips for FX Traders
🧩 Summary: Why Jobless Claims Matter in FX
- Initial Jobless Claims offer one of the earliest insights into U.S. labor market health each week.
- While not as headline-grabbing as NFP or CPI, they often set the tone for short-term market sentiment.
- USD/JPY is particularly reactive, especially when the data deviates from expectations.
🎯 Strategy Tip #1: Focus on Surprise vs. Forecast
“It’s not the number — it’s the surprise.”
- Always check the consensus forecast before the release
- Prepare trading scenarios for both upside and downside surprises
- Use alert tools (e.g. Economic Calendar, TradingView notifications)
🕵️ Strategy Tip #2: Combine with Macro Context
- A strong number in a dovish macro backdrop may still lead to USD selling
- A weak number during a hawkish Fed narrative might be brushed off
✅ Before the release, ask:
- Is the Fed currently leaning hawkish or dovish?
- What are bond yields doing?
- Is the market in risk-on or risk-off mode?
📊 Strategy Tip #3: Use the 5-Minute Chart, but Avoid the First 30 Seconds
- Spikes can be fades or fakeouts in the first few seconds
- Let spreads normalize before entering
- Look for confirmation patterns like engulfing candles or volume spikes
🛠 Strategy Tip #4: Use the 4-Week Moving Average for Swing Trades
- If the 4-week average is trending higher, it could signal labor market deterioration
- If it’s consistently falling, that’s a bullish labor signal
🧠 This can shape your directional bias for USD/JPY or even equities.
✅ Final Takeaway
Initial Jobless Claims are small in size but big in signaling power.
By understanding how traders interpret these weekly reports, you’ll be better equipped to:
- Avoid emotional trades
- Anticipate potential volatility
- Build smarter FX strategies aligned with macro flows
🎯 In a data-driven market, knowing the data is your edge.