Here’s a real-world trade example executed on USD/JPY using weekly Fibonacci retracement levels as the core strategy. This trade, taken on April 10–11, 2025, demonstrates how multi-timeframe analysis and clearly defined risk-reward ratios can guide disciplined entries and exits.
📐 Market Context and Trade Setup
The setup began with a weekly Fibonacci retracement drawn from the low on September 15, 2024 (139.569) to the high on January 5, 2025 (158.868)—a major bullish wave.
Price was trading between the 61.8% (146.972) and 76.4% (143.720) retracement zone, a key area for potential bearish reversals.
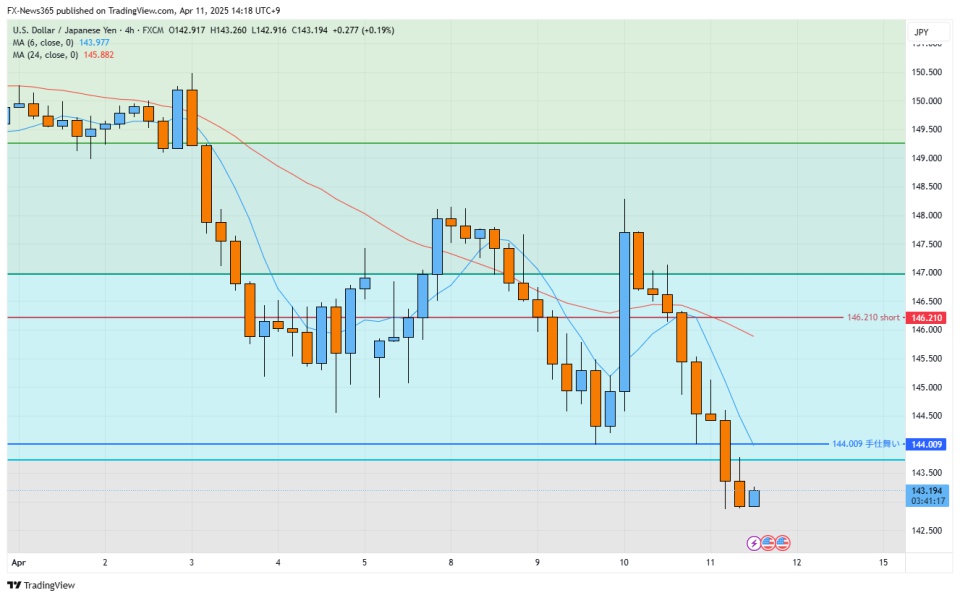
On the 4-hour chart, bearish momentum aligned with this weekly resistance zone, strengthening the short bias. This confluence of higher- and lower-timeframe signals provided a high-probability setup for a short position.
🧾 Trade Details
| Item | Description |
|---|---|
| Pair | USD/JPY |
| Trade Direction | Short |
| Entry Time | April 10, 2025, around 18:20 JST |
| Entry Price | 146.210 |
| Stop Loss | 146.941 (Fibonacci 61.8%) |
| Take Profit | 144.010 |
| Risk-Reward Ratio | 1:3 |
| Lot Size | 0.01 (XMTrading) |
🎯 The risk was defined between entry and the 61.8% retracement, with a 3x reward target placed well below at 144.010.
🎯 Trade Outcome
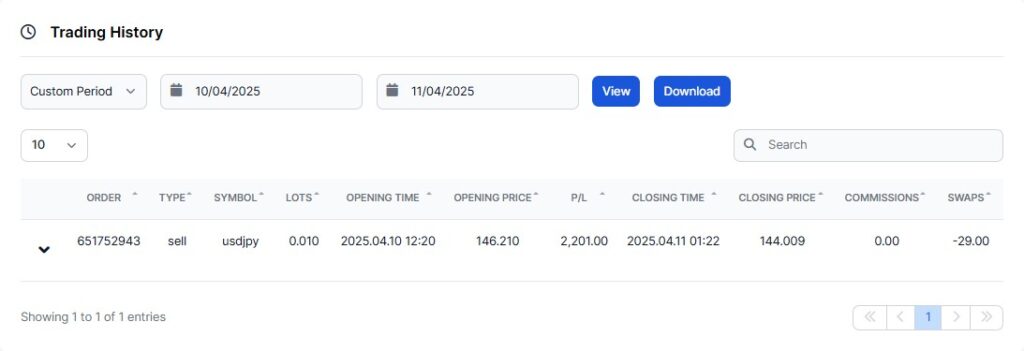
The trade was automatically closed at the target level on April 11, 2025, around 07:20 JST, as price reached the pre-set take profit.
The trade unfolded exactly as planned, aligning with the Fibonacci structure and confirming the strength of the multi-timeframe setup.
🧠 Lessons Learned
- The alignment of weekly Fibonacci resistance and 4-hour bearish momentum was key to this trade.
- Pre-defining the stop-loss and calculating the reward based on a 1:3 ratio provided clarity and discipline.
- Avoiding emotional decisions and relying on structured setups improves long-term consistency.
📈 Charts Used
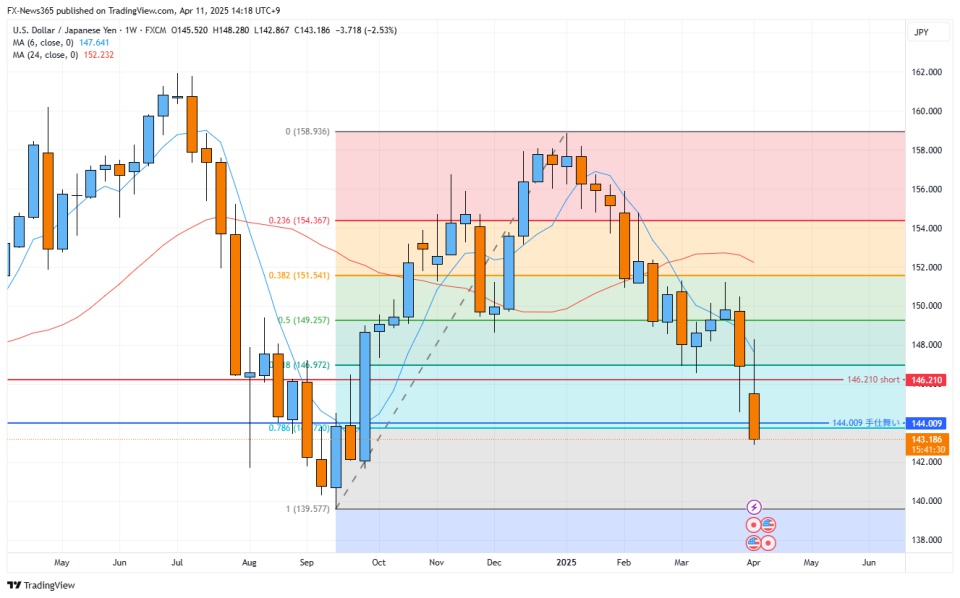
- 📈 Weekly Chart with Fibonacci Retracement (TradingView)
- ⏱ 4H Chart Showing Entry Timing and Momentum Shift
These visuals helped frame the context and confirm the timing of the trade.
📘 Conclusion
This trade highlights how combining long-term resistance zones with short-term momentum shifts can result in high-probability entries.
By using a well-defined Fibonacci zone and risk-reward planning, we were able to execute this trade with confidence and clarity.
✍️ Call to Action
Want to improve your trading skills? Start documenting your trades. Turning your analysis into structured records can build powerful insights over time.