“Breakout entry… then whipsaw. Another fakeout hit your stop-loss—again.”
“Indicators are lagging. Range breaks turn into traps. Nothing seems to work.”
If this feels familiar, you’re not alone.
Many traders try to avoid fakeouts by tweaking indicators, waiting for candle closes, or adding more filters.
But what if the problem isn’t your tools—but your location?
- The best way to avoid fakeouts is not prediction—it’s positioning.
- Fakeouts happen where the market is uncertain. Edge appears where price is respected.
This guide introduces a focused strategy using Fibonacci retracement levels—not as magic lines, but as reference points to identify zones where price action is most likely to behave.
You’ll learn how to read context, not just indicators, and position yourself in high-probability zones.
If you’re tired of being shaken out, and want to step up as a trader who anticipates traps instead of falling into them, this article is for you.
- 📘 What Is a Fakeout in Forex—and Why Should You Care?
- 🧠 The Core Truth: It’s Not About Timing, It’s About Location
- 📏 How Fibonacci Retracement Helps You Find Structure in Chaos
- 🔍 Spotting Fakeouts Using Fibonacci: What to Look For
- 🎯 [Strategy] High-Probability Entry Zones with Fibonacci Retracement
- 💡 Final Thoughts: Don’t Trade Where You Might Get Faked Out—Trade Where You Can Trust the Setup
📘 What Is a Fakeout in Forex—and Why Should You Care?
🔍 The Setup That Lures You In
A fakeout—also known as a false breakout—occurs when price appears to break above resistance or below support convincingly… only to quickly reverse and trap traders on the wrong side.
Sound familiar?
- Price closes above a well-watched range, and you go long—only to see it drop and hit your stop.
- A quick dip below support looks like a breakdown, so you short—only to watch it spring upward in a flash.
These moves are the bane of breakout traders.
They suck you in with a clean structure, then whip in the opposite direction—
not because the chart was “wrong,” but because the market knew where you’d act.
🧠 The Psychology That Gets You Caught
Fakeouts don’t just trap trades—they exploit emotion and assumptions.
Here’s what often happens inside the mind of a trader:
- “I don’t want to miss the move.”
→ FOMO drives a rush entry on the breakout candle. - “This setup worked before.”
→ Past success builds overconfidence—even if the context is different. - “The candle closed beyond the level—it must be valid.”
→ Trusting candle closes without considering the reaction that follows.
In short, fakeouts punish those who react to shape without reading context.
📊 Visual Breakdown: When Breakouts Go Bad
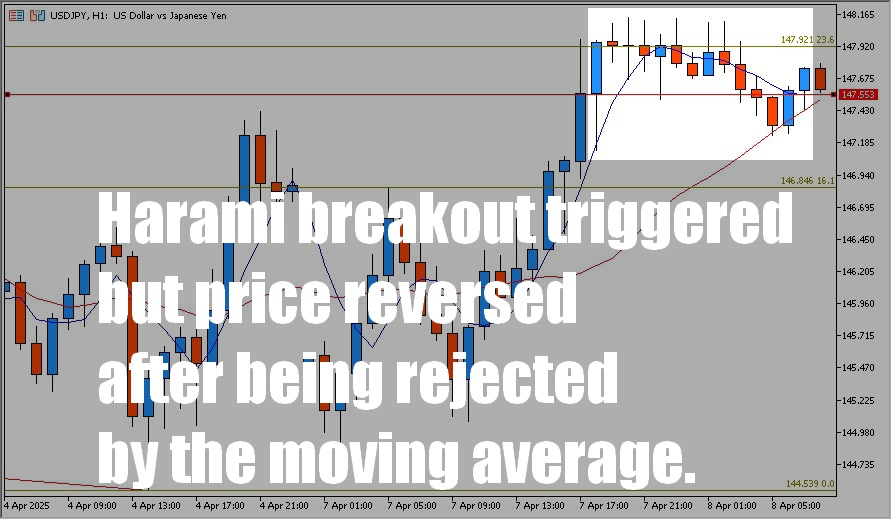
A textbook “harami” inside bar pattern forms across 9 candles.
Eventually, price breaks down from the range—sellers jump in.
But right below sits the 20-period moving average, which acts as a dynamic wall.
Instead of continuation, price bounces violently upward.
Result?
- Short traders get stopped out.
- Price accelerates upward using their stops as buy-side liquidity.
💡 This is classic “stop-hunting” or liquidity engineering—behavior often linked to institutional tactics.
✅ Key Takeaways from This Chapter
- Fakeouts aren’t about shape—they’re about location.
- The truth lies not in “Did it break?”, but “What happened after the break?”
- In upcoming sections, you’ll learn how Fibonacci retracement helps identify trustworthy vs trap-prone zones.
🧠 The Core Truth: It’s Not About Timing, It’s About Location
🎯 Don’t Just “Avoid” Fakeouts—Trade Where They’re Less Likely
Most traders obsess over how to avoid fakeouts.
But ironically, that mindset can increase your exposure to them.
Why?
Because fakeouts are part of how the market works.
Price action often creates false signals to trap weak hands and shake out retail traders.
You can’t eliminate fakeouts—but you can choose not to trade where they happen most.
✅ The solution? Focus on trading in zones where fakeouts are statistically less likely—what we call high-probability areas.
This is how seasoned traders approach the market:
Not with endless filters or perfect indicators, but by positioning themselves where market structure supports their trades.
⚠️ The Danger Zones: Where Fakeouts Thrive
Fakeouts tend to cluster in areas where market conviction is weak or retail emotion is high. Watch out for:
- End-of-trend exhaustion zones
- Low-volatility compression before expansion
- Obvious horizontal levels with too much attention
- Price extremes where positions are heavily skewed
In these places, the market loves to “fake the break” and reverse—because that’s where liquidity lives.
Trading based on shape alone (e.g. candle formations or breakouts) without context makes you easy prey.
✅ Where the Edge Lives: What “High-Probability” Zones Look Like
So what defines a smarter location to trade?
- Clear risk parameters: You know exactly where your stop-loss belongs
- Aligned with higher timeframes: You’re with the broader trend
- Reflective of market psychology: Price is likely to attract responses from other participants
These zones are where structure and sentiment converge—and where fakeouts are far less frequent.
📏 This Is Where Fibonacci Comes In
Still wondering: “How do I actually find those zones?”
Enter Fibonacci retracement—a tool that doesn’t predict, but reveals.
Used by professionals worldwide, Fibonacci helps visualize psychological turning points in the market where high-probability setups often occur.
💡 Shift Your Thinking—And Your Outcomes
- Don’t waste energy trying to avoid every fakeout
- Instead, trade where fakeouts are least likely to succeed
- Fibonacci is the map that helps you find those places
In the next section, we’ll show you exactly how to use Fibonacci retracement to identify these smart zones—with real chart examples.
📏 How Fibonacci Retracement Helps You Find Structure in Chaos
🔢 What Is Fibonacci Retracement?
Fibonacci retracement is a classic charting tool used to identify potential pullback zones within a trend.
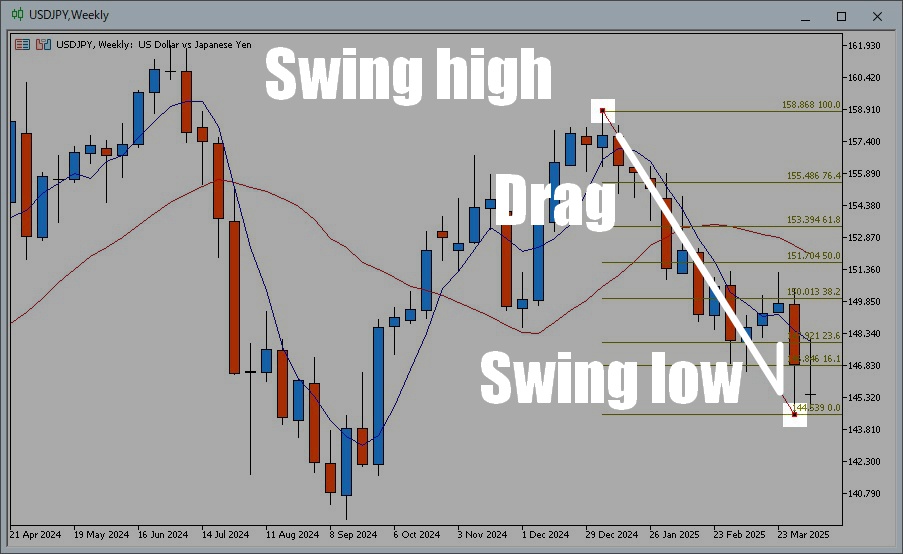
By anchoring the swing high and swing low of a price move, the tool automatically draws horizontal lines at key retracement levels: 38.2%, 50%, and 61.8%—areas where price may hesitate, reverse, or consolidate.
These levels are derived from the Fibonacci sequence, a mathematical pattern found in nature, architecture, and—yes—even in financial markets.
Because so many traders watch them, they often become self-fulfilling zones of support or resistance.
✍️ How to Plot Fibonacci Retracement Correctly
In an uptrend:
Start from the swing low → drag to the swing high (bottom-left to top-right)
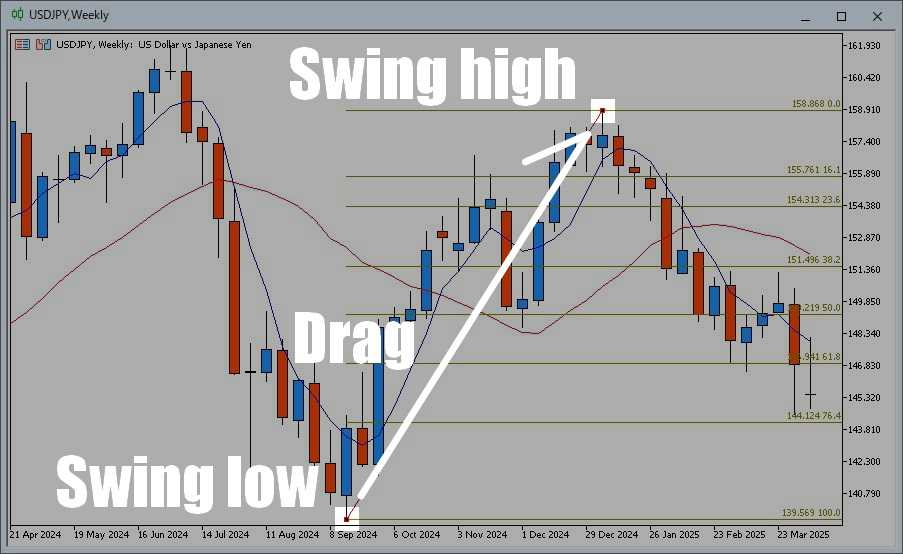
📝 Example: USD/JPY weekly chart — April 9, 2025
Using the September 15, 2024 low and the January 5, 2025 high to anchor Fibonacci, key retracement zones become visible on lower timeframes.
In a downtrend:
Start from the swing high → drag to the swing low (top-left to bottom-right)
📈 Understanding the Key Levels
| Level | Meaning |
|---|---|
| 38.2% | Shallow pullbacks in strong trends often bounce here |
| 50.0% | Not a Fibonacci number, but a widely watched midpoint |
| 61.8% | The “Golden Ratio” — a key reversal area for many traders |
When price approaches these zones and shows signs of reaction (wicks, rejections, consolidations), experienced traders begin watching for confirmation.
❗ Why Fibonacci Helps Avoid Fakeouts
Many fakeouts occur outside of Fibonacci zones—
areas where price has moved too far, too fast, and is due for a trap or reversal.
In contrast, retracement levels like 38.2% or 61.8% tend to attract liquidity, profit-taking, and reversal interest—making them safer places to anticipate real reactions.
✅ If you know where others expect a bounce, you’re less likely to chase bad breakouts.
📊 Case Study: USD/JPY and the 23.6% Level
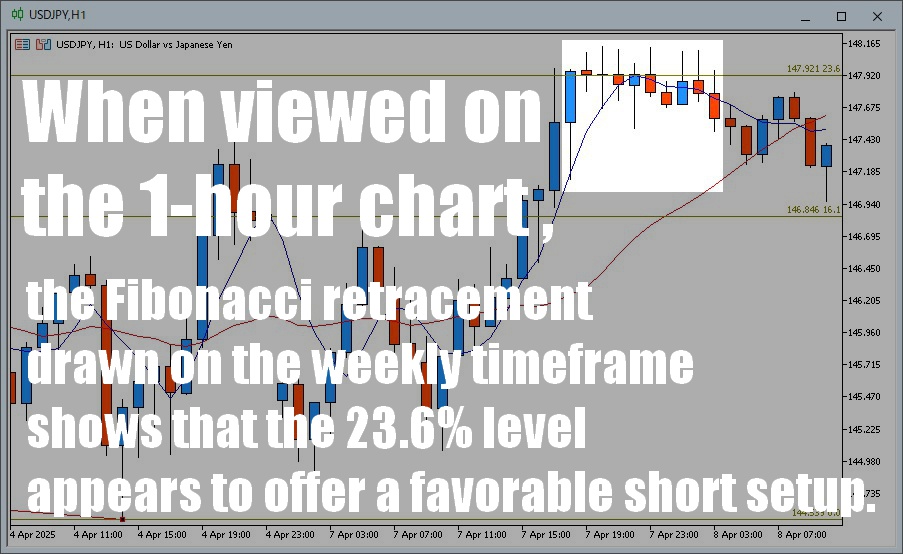
🗓️ Chart snapshot: April 8, 2025 – 1H timeframe
Fibonacci levels drawn on the weekly chart revealed that 23.6% acted as resistance on the intraday timeframe.
Price stalled for 9 hours just below 147.921, offering a clean short setup with over 100 pips of potential downside.
Even though this became clearer in hindsight, the Fibonacci level gave a precise place to watch for rejection.
💡 Key Takeaways
- Fibonacci retracement acts as a map of expectation—where reactions should occur
- Drawing it yourself forces you to view price as a wave, not noise
- Areas outside key levels are danger zones for fakeouts;
areas within key levels are higher-probability reaction zones
In the next section, we’ll explore how to use these levels not just to watch—but to analyze fakeouts before they trigger your stop-loss.
🔍 Spotting Fakeouts Using Fibonacci: What to Look For
👀 Don’t Just Watch the Break—Watch Where It Breaks From
In the previous section, we covered how to draw and interpret Fibonacci retracement levels.
Now it’s time to level up: let’s use these levels to spot potential fakeouts before they trap you.
The key isn’t just in seeing a breakout—but in how and where price breaks relative to the Fibonacci zones.
❌ Common Characteristics of a Fakeout Move
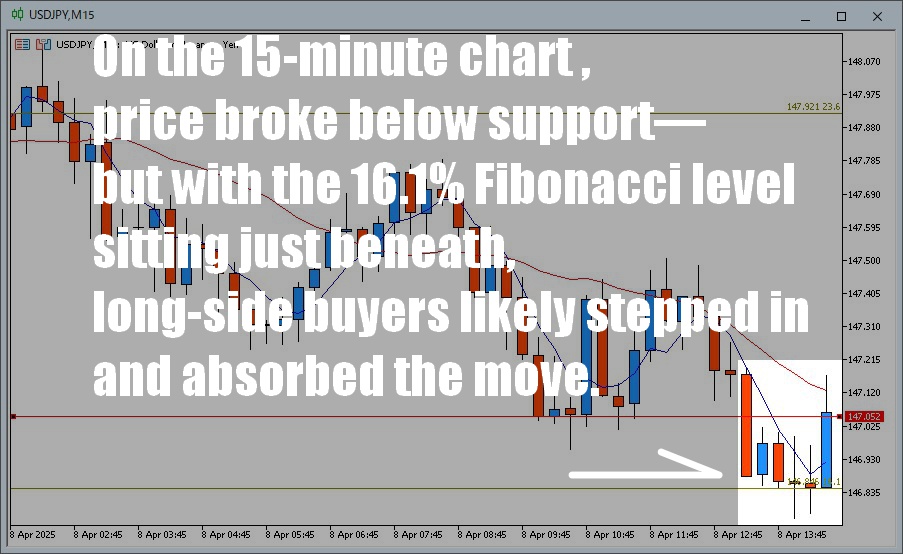
One of the most deceptive setups is when a breakout occurs just before reaching a Fibonacci level.
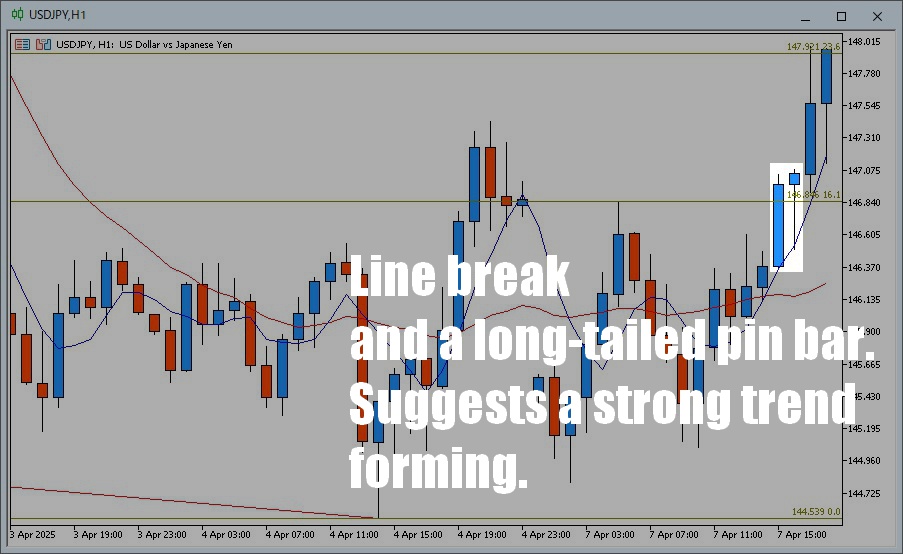
🗓️ Example: April 8, 2025 – USD/JPY, 15-minute chart
Price breaks below a local support line—but just below lies the 16.1% Fibonacci level.
That zone gets quickly defended by buyers, triggering a pullback that traps early short-sellers.
In this case, the breakout was likely a liquidity sweep, not a genuine move.
When you see breakouts without space to breathe before hitting a major Fib level, be cautious—it’s often a setup for disappointment.
✅ What a Trustworthy Breakout Looks Like
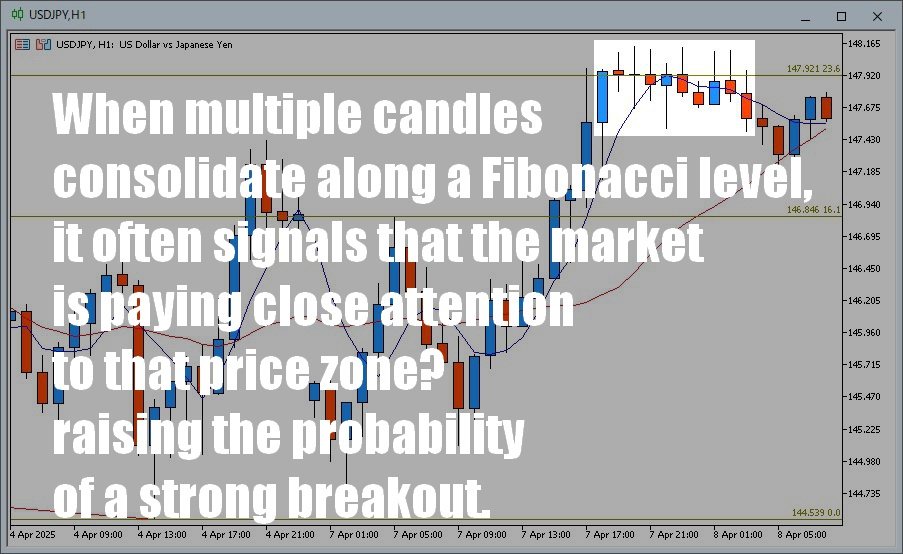
🗓️ Example: April 8, 2025 – USD/JPY, 60-minute chart (2:00 PM)
Price consolidates tightly along a Fibonacci level, with multiple candles sticking to the zone.
This behavior often indicates market-wide awareness of that price level—and increases the chance of a meaningful breakout or reversal.
🗓️ Example: April 8, 2025 – USD/JPY, 60-minute chart (12:00 AM)
A candle clearly closes beyond a Fibonacci level, and the next candle treats it as new support.
This combination suggests that price has accepted the break—and may move confidently toward the next Fib level.
💡 Key Takeaway
Fakeouts are often born from rushed, shallow moves into support or resistance.
In contrast, real breaks tend to show structure, hesitation, and confirmation near key Fibonacci zones.
Watch how price behaves around these levels—not just whether it touches them.
Fibonacci isn’t magic, but it helps you frame the market’s intentions with far more clarity.
🎯 [Strategy] High-Probability Entry Zones with Fibonacci Retracement
Premise: In trading, confluence is king. A single technical signal isn’t enough—what matters is when multiple pieces of evidence align.
When using Fibonacci retracement in your strategy, the goal isn’t simply to enter a trade when price touches a Fib level.
Instead, you want to ask: Is this level supported by other forms of confluence?
Below are three common setups where fakeouts are less likely, and the chance of trend continuation or strong reversal is higher.
✅ Sideways Candle Clustering → Continuation Breakout
Setup: Multiple candles hover tightly along a key Fibonacci level—especially between 50% and 61.8% retracements.
Strategy: Enter in the direction of the breakout once a strong-bodied candle clearly breaks the range.
Why this works:
- Consolidation near key Fib levels suggests the market is evaluating that price zone.
- A clean breakout reflects agreement among participants, leading to momentum.
📝 Pro Tip:
When you see candles “sticking” to a Fib level, it’s a sign of pressure building.
Once that tension is released with a breakout, the move is often decisive and less likely to fake out.
✅ Summary: It’s Not Just the Level—It’s the Reaction
Don’t trade a line—trade the reaction to the line.
Observing how price behaves around a Fibonacci level (price action) is what separates smart entries from false ones.
🎯 Fibonacci × Candlestick Patterns × Market Reaction
When all three align, you’ve found a zone worth targeting.
💡 Final Thoughts: Don’t Trade Where You Might Get Faked Out—Trade Where You Can Trust the Setup
In forex, fakeouts aren’t an anomaly—they’re part of the game.
You can’t eliminate them. But you can avoid getting caught by them.
If you constantly ask, “Is this the real breakout?” and enter trades with doubt, you’ll find yourself second-guessing every move.
That’s why the real shift in mindset is this:
✅ Don’t trade where fakeouts happen. Trade where confidence builds.
This is exactly where Fibonacci retracement becomes such a powerful tool—it helps define those price zones where structure, confluence, and psychology align.
🔁 Let’s Recap the Three Key Takeaways:
- Fakeouts are about context, not just candles.
- Fibonacci visualizes that context, helping you understand what the market might be thinking.
- Price reaction to a level matters more than just touching it.
🎯 Fakeouts exist because someone got trapped.
If you can enter at zones where conviction is clear,
what looks like a trap for others becomes an opportunity for you.