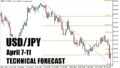
USD/JPY continues to trade in a well-defined downtrend, with bearish momentum accelerating after breaking below key support levels. As of April 7, 2025, the pair hovers in the mid-145 range. In this technical outlook, we outline a tactical sell limit strategy at 146.30, designed to catch a potential pullback in line with the prevailing trend. With well-defined stop-loss and take-profit levels, this setup prioritizes high risk-to-reward efficiency while minimizing emotional decision-making.
✅ Key Highlights
- 📉 Downtrend in progress: USD/JPY remains below key moving averages on the daily and 4H charts.
- 🎯 Sell limit pending at 146.30: Targeting a potential retracement toward former resistance.
- 🛡️ Stop-loss at 146.80 / Take-profit at 145.00: Balanced risk control and reward potential (R: 2.6).
- ⏳ No entry yet: Strategy is to patiently wait for price to come to the setup — no need to chase.
- 📊 Technical confluence: Resistance zone aligns with past price structure and MA levels.
- 📊 Technical Analysis — Daily and 4-Hour Charts
- 🎯 Trade Plan — Sell Limit Order at 146.30
- 🧠 Strategy Commentary — Why “Wait and Strike” Works Now
- 📝 Summary & Strategic Outlook
- 📌 Next Steps & Trade Management Plan
- 🔄 [Trade Update] Stop-Loss Hit — Setup Invalidated
- 🔄 [Trade Re-entry After Stop-Out] Pin Bar Confirmation Triggers Fresh Short Setup (April 7, 2025 – 12:00 PM JST)
📊 Technical Analysis — Daily and 4-Hour Charts
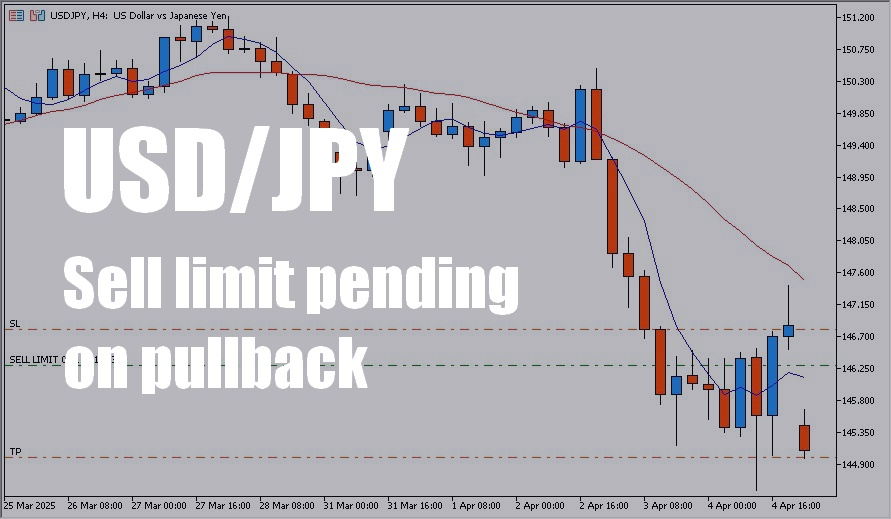
📅 Daily Chart Outlook
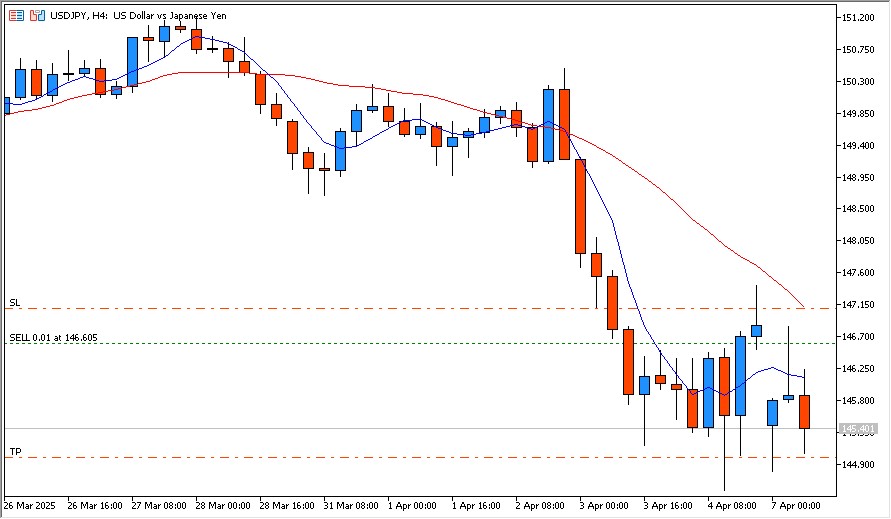
The pair remains in a strong downtrend, trading below both the 5-day and 20-day moving averages after a sharp breakdown from the 149.50 zone.
The daily chart of USD/JPY shows a sustained downtrend since late March, marked by a series of strong bearish candles. The price has broken below both the 5-day and 20-day moving averages, indicating growing downside pressure.
Key observations:
- Price structure: Lower highs and lower lows confirming trend continuation.
- Moving averages: Both short- and mid-term MAs are sloping downward.
- Psychological zone: The 145.00 level may act as a near-term support, but bearish sentiment remains dominant.
This suggests any retracement toward resistance could provide an ideal opportunity to rejoin the trend.
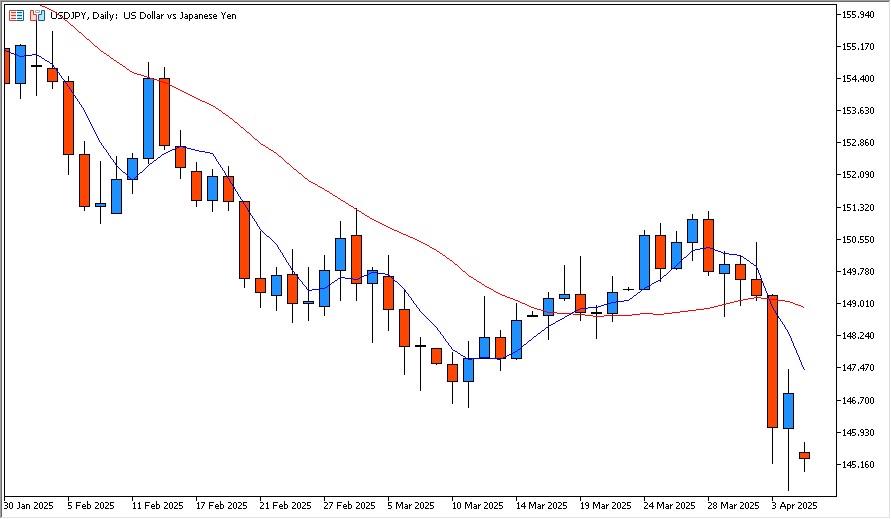
⏱ 4-Hour Chart Analysis
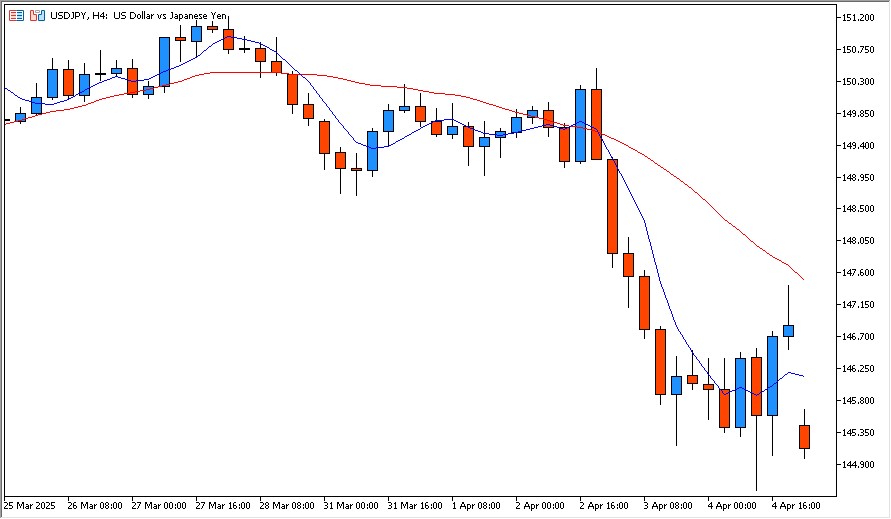
Price remains below the 20-period moving average, with 146.30 acting as a key resistance level. The chart supports a pullback-based sell limit strategy.
Zooming into the 4-hour chart, we see additional confluence supporting a tactical sell setup:
- 146.30 level corresponds with a recent reaction high, making it a likely resistance zone if price pulls back.
- Price is currently trading near the lower end of its short-term range (~145.00–145.50), suggesting that a pullback would be corrective rather than a trend reversal.
- The down-sloping 50-period MA on the 4H chart also aligns closely with the 146.30 zone, strengthening the case for a sell limit order.
Together, these factors create a compelling setup to sell the bounce rather than chase the drop — a principle often favored by experienced FX traders.
🧠 Summary of Technical Signals
| Signal Type | Indicator or Price Level | Interpretation |
|---|---|---|
| Trend Direction | Daily & 4H: Downtrend | Bearish continuation bias |
| Resistance Zone | 146.30 | Prior swing high / MA confluence |
| Entry Strategy | Sell Limit at 146.30 | Wait for pullback |
| Support Target | 145.00 | TP level aligned with structure |
🎯 Trade Plan — Sell Limit Order at 146.30
To align with the ongoing downtrend while avoiding emotional entries, we’re deploying a sell limit order at a key resistance level.
🎯 Trade Setup Summary
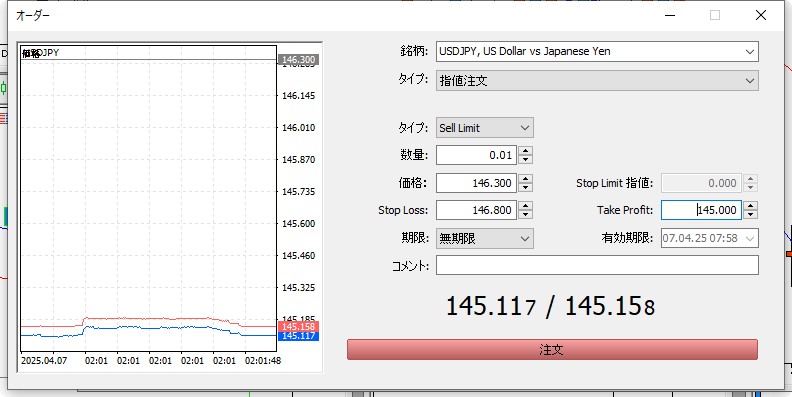
The trade is pre-configured with a sell limit entry at 146.300, stop-loss at 146.800, and take-profit at 145.000. The position size is set to 0.01 lots with no expiration.
| Parameter | Value | Rationale |
|---|---|---|
| Entry | Sell Limit @ 146.30 | Key resistance zone + moving average confluence |
| Stop Loss | 146.80 | Above recent highs to protect against breakout |
| Take Profit | 145.00 | Technical support zone and psychological level |
| Risk:Reward | ≈ 1:2.6 | High efficiency setup with limited downside |
🛠 Why a Sell Limit Order?
A sell limit order allows the trader to:
- Enter at a strategically planned price level, rather than chasing the market.
- Target a retracement toward resistance, in line with the prevailing downtrend.
- Reduce overtrading and increase psychological discipline by letting the market come to the setup.
This is a textbook example of a “wait and strike” strategy — ideal in trending markets where temporary pullbacks offer high-probability entries.
📊 Risk Control Perspective
- Stop loss at 146.80 gives room for market noise while invalidating the setup if exceeded.
- Take profit at 145.00 coincides with the lower support band visible on both 4H and daily charts.
- Position sizing can be adjusted to risk no more than 1–2% of trading capital, depending on your account size.
💡 Optional Enhancements
Traders may also consider:
- Setting an expiration on the order (e.g., valid for 48 hours) if the market environment changes.
- Monitoring upcoming economic events or Fed-related headlines that could affect the dollar’s short-term behavior.
🧠 Strategy Commentary — Why “Wait and Strike” Works Now
In volatile markets, it’s easy to get caught up in the noise — chasing price, reacting emotionally, and overtrading. But in downtrending conditions like we’re seeing in USD/JPY, the best opportunities often arise not from momentum, but from discipline and patience.
🧠 Why “Wait and Strike” is Effective Now
- Trend Clarity:
The downtrend is clearly established on both daily and 4-hour timeframes. Jumping in at random points increases the risk of short-term reversal exposure. Waiting for a structured pullback, like to 146.30, adds confluence and control. - Psychological Anchoring:
Many traders panic-buy after a steep drop, creating a temporary pullback. Sell limit strategies capitalize on this behavior, allowing calm traders to enter against the crowd but with the trend. - Avoiding Whipsaws:
Market noise and fakeouts are common when chasing breakouts. Using limit orders allows traders to filter out poor entries and focus on high-probability zones. - Risk Management Discipline:
By defining SL and TP in advance, you remove emotion from the decision-making process — a key trait of consistently successful traders.
📌 Core Trading Philosophy in Play:
“Don’t chase the market. Let the market come to you.”
This strategy embodies the principle of anticipation, not reaction — something institutional traders often rely on.
✅ Final Note on Market Timing
While this setup isn’t guaranteed to fill, that’s precisely what gives it edge. It’s a strategic bet that, if the market pulls back, offers:
- Favorable price
- Clear invalidation level
- Solid reward potential
Whether it triggers or not, the process is sound — and that’s what matters most in professional trading.
📝 Summary & Strategic Outlook
🧾 Summary of the Trade Setup
- Trend: USD/JPY is in a well-defined downtrend on both the daily and 4H charts.
- Entry Strategy: A sell limit order is set at 146.30, waiting for a technical pullback toward resistance.
- Stop Loss: 146.80 — above the last key swing high.
- Take Profit: 145.00 — near a recent support zone and round number level.
- Risk-to-Reward: Approximately 1:2.6 — favoring asymmetrical reward potential.
- Execution style: Patient and non-reactive. No entry yet; order is pending.
📈 Strategic Outlook for USD/JPY This Week
Here are the key directional scenarios traders should keep in mind:
✅ Scenario 1: Pullback to 146.30 triggers the sell
- Likely outcome: Entry activates. Watch for price rejection near resistance.
- Strategy: Let TP/SL play out. Monitor volatility around key U.S. events.
❌ Scenario 2: Price continues falling without retracement
- Likely outcome: Order remains unfilled.
- Strategy: Stay disciplined — don’t chase. Wait for a fresh setup next week.
⚠️ Scenario 3: Break above 146.80 invalidates the trend
- Likely outcome: Sell idea is negated.
- Strategy: Cancel order. Reassess trend structure; prepare for potential reversal setups.
🧭 Outlook Summary
The beauty of this strategy lies in clarity, structure, and objectivity. Whether the trade is triggered or not, the process strengthens trading discipline and aligns your actions with your edge — not emotion.
This approach is well-suited to trend-based traders who prefer “structure over speed”, and who know that the best trades are often the ones that come to you.
📌 Next Steps & Trade Management Plan
Once the sell limit strategy is in place, the key is to avoid unnecessary screen-watching or emotional impulses. Let the market come to your setup, and be prepared for multiple outcomes.
⏱ If the Order Gets Triggered at 146.30
- Action: Let the trade play out with your pre-set SL (146.80) and TP (145.00).
- Focus: Do not adjust the plan mid-trade unless major macro events force a reassessment.
- Optional: Set a price alert at 146.20–146.35 to monitor price action during the trigger phase.
🚫 If Price Keeps Falling and Order Is Not Filled
- Action: Do nothing. This is a sign that the market didn’t provide your desired entry.
- Mindset: Missing a trade is better than forcing one. There will always be another opportunity.
- Optional: Reevaluate the chart in 1–2 days to look for a new setup.
🔄 If the Market Rallies and Breaks Above 146.80
- Action: Cancel the order. The setup is invalidated.
- Next Step: Watch for a possible trend reversal structure (higher low, bullish MA cross, etc.).
- Discipline: Treat the invalidation as a success — you followed your rules.
🧠 Trade Management Philosophy
Great trading isn’t about being right every time — it’s about consistently following your process.
By laying out multiple outcomes in advance, you reduce anxiety, avoid overreaction, and become the kind of trader who stays in control — regardless of what the market does.
🔄 [Trade Update] Stop-Loss Hit — Setup Invalidated
The sell limit order at 146.30 was successfully triggered as planned.
However, the price continued to rise and eventually hit the stop-loss at 146.80, closing the trade at a loss.
Despite the result, the trade was executed exactly according to the predefined plan — no emotional adjustments were made mid-trade.
In that sense, this was a successful trade in terms of discipline and process.
🧠 Lessons Learned
- The setup to sell into the pullback was structurally valid, but the market chose a different direction.
- Respecting the stop-loss level without hesitation was a reminder of the power of risk control.
- Even a losing trade can be a “win” when it’s executed according to rules and with strategic clarity.
📌 Strategic Outlook Moving Forward
Now that 146.80 has been breached, the previous resistance zone is no longer valid.
Two new approaches are under consideration:
- Reassess whether a trend reversal is forming
- Wait for a new bearish setup aligned with market structure before re-engaging
💬 Final Note
A losing trade isn’t a failure —
executing a loss with discipline is a victory in disguise.
I’ll stay patient, continue monitoring the market, and be ready when the next high-probability opportunity presents itself.
🔄 [Trade Re-entry After Stop-Out] Pin Bar Confirmation Triggers Fresh Short Setup (April 7, 2025 – 12:00 PM JST)
The initial short setup at 146.30 was stopped out at 146.80, as the market continued to rise after the entry.
However, upon reevaluating the price action on the 5-minute chart, I identified a new opportunity to re-enter the market with a fresh short position.
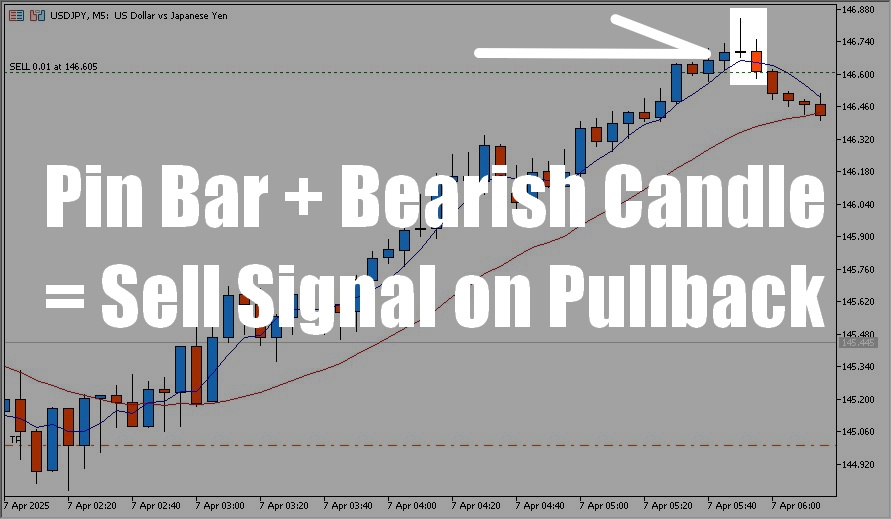
At 11:50 AM JST, a bearish pin bar formed, followed by a strong bearish candle at 11:55 AM.
This two-candle sequence served as a classic “sell signal” after a potential stop-hunt or false breakout to the upside.
▶️ Entry Details
- Entry: 146.605
- Stop-Loss: 147.105 (above recent spike high)
- Take-Profit: 145.000 (psychological and structural support zone)
- Setup Logic: Rejection at resistance with pin bar + bearish confirmation on 5-minute chart
📊 Risk-Reward Evaluation
With a stop of 50.5 pips and a take-profit target of 160.5 pips,
the risk-reward ratio stands at approximately 1:3.2 — a highly favorable setup.
Rather than reacting emotionally after the stop-out, I waited for a clear technical confirmation before re-entering the market,
staying true to the “wait and strike” discipline outlined in the original strategy.
🧠 Technical Context & Signal Significance
The pin bar indicates a failed breakout attempt and rejection near resistance,
while the following bearish candle confirmed seller control.
This pattern often signals that a retracement has ended and trend continuation may resume, especially when aligned with a higher timeframe downtrend.
📘 Forward Strategy
- If price reaches 145.00, the trade will be closed as planned.
- A bounce from 145.40 could lead to short-term consolidation.
- However, if the 4-hour candle closes below 145.40, I’ll monitor for follow-through weakness and potentially re-enter with a new setup after taking profit.
💬 Final Note
Re-entering after a stop-out isn’t emotional — it’s strategic.
What matters is the structure, the signal, and sticking to the process.
This trade reflects the core principle of “structured re-engagement after loss” — a key to long-term profitability in FX trading.