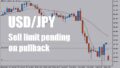
The USD/JPY pair enters the week of April 7–11 under clear bearish pressure, with the pair trading below major moving averages across all key timeframes. On the weekly chart, price action suggests a deepening downtrend, with significant room below to the key support zone near 140.80.
However, volatility could spike midweek as markets brace for the release of the U.S. March CPI on April 10, a potential game-changer for dollar sentiment. In this report, we break down multi-timeframe technical charts and identify trade scenarios for the week, helping traders navigate the shifting landscape with confidence.
✅ Key Takeaways
- USD/JPY is extending its weekly downtrend, with room to test the 140.80 support zone
- Daily and 4H charts indicate limited upside as the pair remains capped by the 20-day moving average
- Key economic event this week: U.S. CPI (April 10), which may shift rate expectations and trigger volatility
- Short-term rebounds are likely to face resistance around 147.50–148.00
- Bearish setups remain favored unless a clear breakout above 148.00 occurs
📅 Key Economic Events for USD/JPY (April 7–11, 2025)
This week features several key U.S. economic releases that are likely to impact USD/JPY price action.
The most critical among them are the U.S. Consumer Price Index (CPI) on Thursday, April 10, and the Producer Price Index (PPI) on Friday, April 11.
Both inflation reports are directly tied to the Federal Reserve’s rate policy outlook and could drive significant dollar volatility.
Here is a summary of the key data to watch this week (times in JST):
📆 Economic Calendar (JST)
| Date | Time | Event | Impact | Notes |
|---|---|---|---|---|
| Apr 8 (Tue) | 08:50 | Japan Current Account & Trade Balance | ★★ | May support JPY buying; impact depends on surprise level |
| Apr 9 (Wed) | 14:00 | Japan Consumer Sentiment Index | ★★ | Early indicator of domestic sentiment; limited market impact |
| Apr 10 (Thu) | 21:30 | 🇺🇸 U.S. CPI (Headline/Core, m/m & y/y) | ★★★ | Top-tier event—could trigger large USD/JPY swings depending on results |
| Apr 10 (Thu) | 21:30 | 🇺🇸 U.S. Initial Jobless Claims | ★★ | Often assessed alongside CPI for labor market insight |
| Apr 11 (Fri) | 21:30 | 🇺🇸 U.S. PPI (Headline/Core) | ★★ | CPI companion indicator—used to assess inflation persistence |
| Apr 11 (Fri) | 23:00 | 🇺🇸 University of Michigan Consumer Sentiment (Prelim) | ★★ | Tracks consumer mood and inflation expectations; may influence USD sentiment |
🧭 Trader’s Notes
- CPI is the week’s top risk event, potentially altering Fed expectations and USD direction.
- PPI and the Michigan Sentiment Index serve as follow-ups, offering insight into inflation stickiness and consumer psychology.
- Japanese data like Current Account and Consumer Sentiment may offer minor yen-driven reactions, particularly if results surprise.
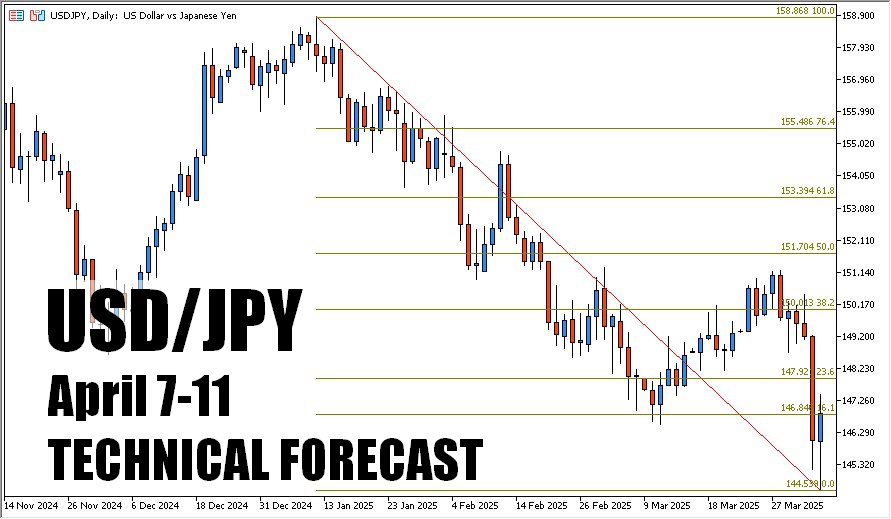
📉 Weekly Chart: Eyes on 140.80 Support
The USD/JPY pair has clearly broken beneath its 20-week moving average, signaling a shift in medium-term momentum. Last week’s candle closed decisively below this average, with multiple weekly closes now reinforcing a sustained bearish bias.
🔻 Key Technical Features
- Lower highs and lower lows confirm a downtrend structure
- The 20-week MA has transitioned from dynamic support to new resistance
- No major support until the 140.80 zone, which served as a strong floor in June and November 2024
At the current level (146.86 as of April 5 close), the pair sits roughly 600 pips above the 140.80 support, leaving plenty of room for further downside pressure if momentum continues.
🧭 Trader’s Insight
Weekly chart context suggests that short-term rallies are opportunities to scale into short positions, not signs of reversal.
If 140.80 breaks, it could open the door to a much deeper correction, potentially toward the 138.00–136.00 range over the coming weeks.
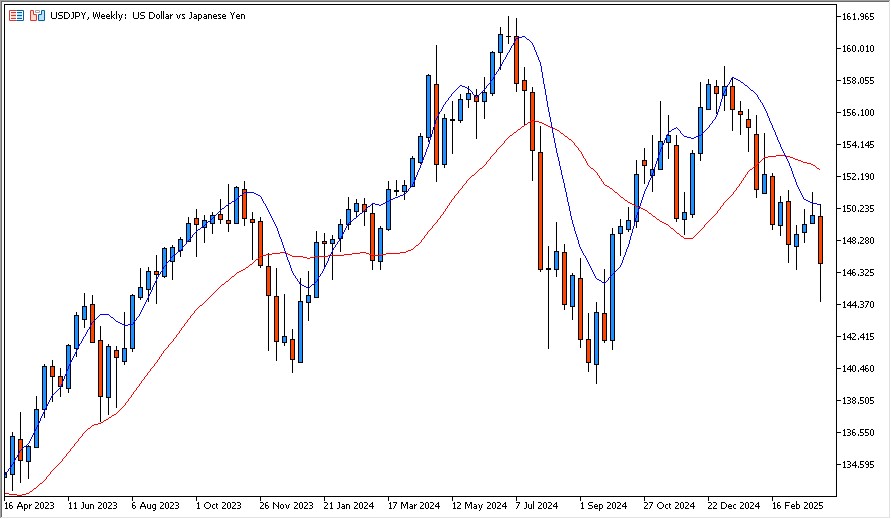
📊 Daily Chart: 20-Day MA Still Capping Recovery
On the daily timeframe, USD/JPY remains in a clear downtrend, having lost over 250 pips since late March. While a minor rebound was observed around the April 4 low, momentum remains weak and rallies are being capped consistently below the 20-day moving average.
🔍 Technical Characteristics
- The pair is trading below both the 5-day and 20-day moving averages
- A bearish crossover between the 5MA and 20MA remains intact
- Attempts to break higher have repeatedly failed near the 147.50–148.00 zone
- A Fibonacci retracement from the Jan 10 high to the April 4 low shows the 23.6% level at 147.92—a potential sell zone
🔸 Resistance and Support Zones
| Level | Meaning |
|---|---|
| 147.50–148.00 | Key resistance from moving averages and former support |
| 145.00 | Psychological and structural support |
| 140.80 | Weekly support target (medium-term) |
📐 Fibonacci View: Mapping the Pullback Resistance Zone
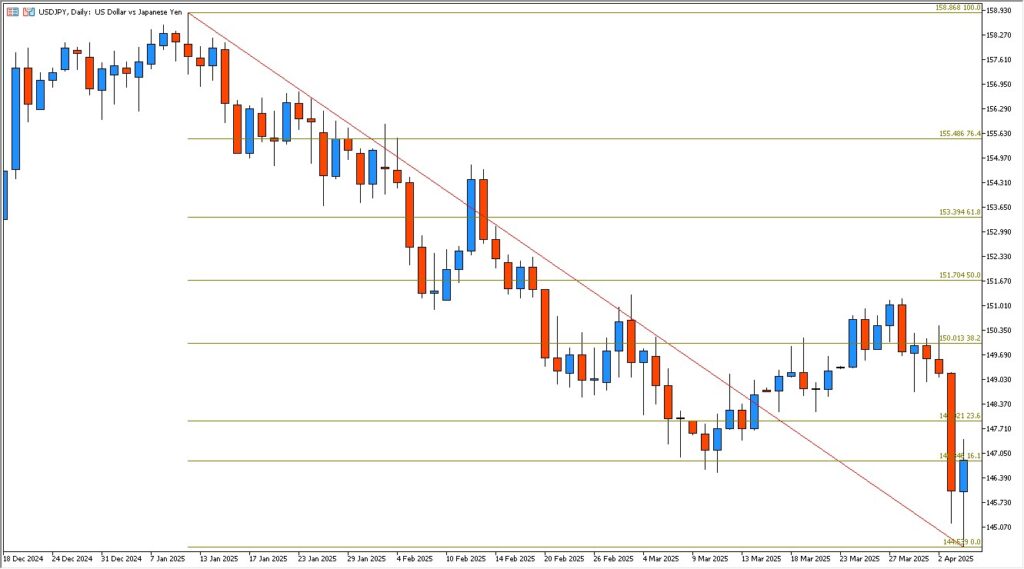
Using the January 10 high (158.86) and the April 4 low (145.95) as reference points, a Fibonacci retracement reveals that USD/JPY has stalled near the 16.1% retracement level at 146.85. This aligns closely with the current market price (146.86 as of April 5 close), suggesting that the first leg of the rebound may be facing resistance.
The next key level on the Fibonacci map is the 23.6% retracement at 147.92, which sits just below the psychological 148.00 handle and overlaps with a former support-turned-resistance zone. This area is likely to attract selling interest if reached, especially in the lead-up to Thursday’s U.S. CPI data.
📉 Fibonacci-Based Resistance Zones:
| Level | Technical Meaning |
|---|---|
| 146.85 | 16.1% retracement — near-term inflection point |
| 147.92 | 23.6% retracement — potential sell zone and resistance cap |
| 150.01 | 38.2% retracement — upper resistance if CPI sharply surprises |
🧭 Strategic Note: Fibonacci retracements provide a valuable framework for identifying pullback zones within a downtrend. As long as the price remains below the 20-day MA and under key Fib levels, rallies should be treated as shorting opportunities rather than trend reversals.
🧭 Trader’s Insight
As long as the price remains below the 20-day MA, the default stance should be bearish.
Rebounds into the 147.50–148.00 zone offer attractive opportunities for re-entry into short positions, especially if CPI fails to lift the dollar meaningfully.
⏱ 4H Chart: Rebound Within a Bearish Framework
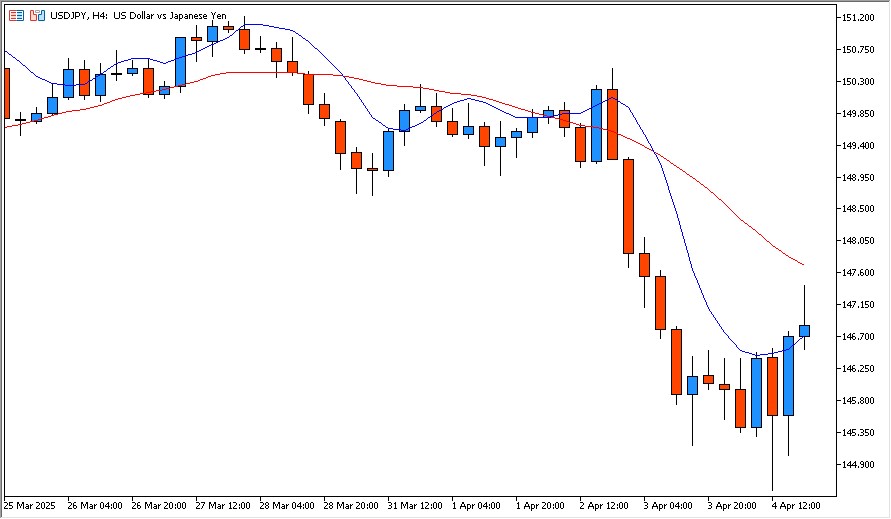
The 4-hour chart reveals a classic bear market rebound—a short-term recovery within a broader downtrend. After hitting a low near 145.50 on April 3, USD/JPY staged a modest bounce, but the overall structure continues to favor sellers.
🧱 Technical Structure
- Lower highs and lower lows remain intact on the 4H chart
- The rebound is capped by the descending 20-period moving average
- The 5-period MA remains below the 20-period MA, keeping bearish momentum in play
- Previous support levels are now acting as resistance, particularly around 147.50
🔸 Intraday Key Levels
| Level | Role |
|---|---|
| 147.50 | Key resistance from former support zone |
| 146.00 | Short-term pivot — break could accelerate selling |
| 145.00 | April 3 low — key for downside continuation |
🧭 Trader’s Insight
Unless we see a clear break and hold above 147.50, intraday rallies should be viewed as shorting opportunities.
A drop below 146.00 could reignite momentum toward 145.00 and beyond, especially if CPI triggers risk-off sentiment or dollar weakness.
🎯 Trade Scenarios: Key Levels to Watch
With bearish momentum intact on all major timeframes, USD/JPY enters a critical week where technical and macro forces may converge. The market is watching the 147.50–148.00 resistance zone as a potential ceiling, while a breakdown below 146.00 or 145.00 could open the path toward deeper downside targets.
To navigate this, here are the two primary directional scenarios traders should consider:
📈 Bullish Scenario: Short-Term Relief Rally
If the U.S. CPI comes in hotter than expected and lifts U.S. yields, USD/JPY may attempt to rally back toward key resistance levels.
- Trigger: CPI > forecast (especially core CPI above +0.4% m/m)
- Upside targets:
- 147.50 — 20-day MA & prior support-turned-resistance
- 147.92 — 23.6% Fibonacci retracement from Jan 10 high
- 148.00 — psychological resistance
- Risk: Fails to clear 148.00 could result in a sharp reversal
📉 Bearish Scenario: Rally Fades or CPI Disappoints
If CPI is soft or fails to shift market sentiment, USD/JPY may resume its downtrend, especially if support levels give way.
- Trigger: CPI < forecast or yields fall post-release
- Downside targets:
- 145.00 — April 3 low
- 142.00 — minor support from Nov 2024
- 140.80 — major weekly support (watch for a breakout trigger)
🧭 Strategic View
Traders should remain tactically bearish, using rallies as opportunities to scale into shorts, particularly below 148.00.
As CPI draws near, risk management becomes critical—expect increased volatility and possible whipsaws around the release.
🧭 Summary: Bearish Bias Intact, CPI May Trigger Volatility
USD/JPY remains structurally bearish across weekly, daily, and 4-hour timeframes. The breakdown below the 20-week moving average, combined with failure to reclaim the 20-day MA, highlights persistent downside pressure in the current environment.
While short-term rebounds are possible—particularly if CPI data surprises to the upside—the broader setup continues to favor sellers unless the pair can break decisively above the 148.00 mark.
✅ Weekly Outlook Recap
- Trend bias: Bearish across all timeframes
- Key resistance: 147.50–148.00
- Primary downside target: 140.80 (weekly support)
- Main risk event: U.S. CPI on April 10
💡 Final Thought for Traders
This is a week where patience and discipline matter most.
Allow volatility to play out around CPI, and look for high-probability setups aligned with the prevailing trend.
Unless the technicals shift materially, rallies should be faded, not chased.