India’s latest Balance of Payments data for Q3 FY2024-25 reveals a troubling macro picture: a widening current account deficit and accelerating capital outflows, especially from equity markets. For FX traders, these developments signal growing medium-term pressure on the Indian rupee. This article dissects the BoP data, explores key macro drivers, and analyzes the USD/INR technical setup—backed by real-time trader sentiment from X.
✅ Key Takeaways
- India’s current account deficit expanded to –$11.5B in Q3, driven by a deepening trade gap and slower services exports.
- Foreign investors withdrew $11.4B from equities, while partially reallocating funds to Indian bonds via the FAR route.
- The rupee remains under pressure, despite RBI intervention and stable crude prices.
- USD/INR shows signs of a mid-term bullish trend, with strong support zones forming on the daily chart.
- Trader sentiment on X highlights rupee depreciation as a key market theme for Q2 2025.
- 🧭 Why USD/INR Deserves Your Attention Right Now
- 📊 India’s Q3 BoP Snapshot: CAD Widens, Capital Flees
- 🔍 Three Structural Shifts FX Traders Must Watch
- 🌐 Macroeconomic Pressures Driving USD/INR Trends
- 📈 Charting the Rupee – Is USD/INR Set for a Mid-Term Rally?
- 🎯 Strategic Trade Scenarios for the Coming Weeks
- 📣 What Market Voices Are Saying on X
- 🔚 Conclusion – What to Watch and Why It Matters
- 📘 Further Reading & Data Sources
🧭 Why USD/INR Deserves Your Attention Right Now
While the FX world often fixates on majors like EUR/USD or USD/JPY, the USD/INR pair has quietly emerged as a critical pressure point in global markets. With India facing a widening current account deficit and surging capital outflows, the rupee is entering a phase of heightened vulnerability—and opportunity.
Two recent developments have brought USD/INR into sharper focus:
- India’s Q3 Balance of Payments data revealed not just another current account deficit, but one paired with significant equity outflows, suggesting weakening investor confidence.
- Macro tensions including U.S. tariffs, shifting oil prices, and Fed policy are creating a volatile external environment for emerging markets. Among EMFX, the rupee stands particularly exposed due to India’s twin deficit problem.
For traders seeking asymmetric plays in the FX space, USD/INR now offers a potent mix of fundamental misalignment, technical triggers, and underexploited volatility. With the RBI walking a tightrope between defending the rupee and supporting growth, the stage is set for directional opportunities in Q2 2025.
📊 India’s Q3 BoP Snapshot: CAD Widens, Capital Flees
India’s Balance of Payments (BoP) data for Q3 FY2024–25 (October–December 2024), released by the Reserve Bank of India on March 28, revealed growing macroeconomic imbalances.
🔻 Key figures from the report:
- Current Account Deficit (CAD): –$11.5 billion
– A slight increase from Q2 (–$11.2B), mainly due to a widening trade deficit (–$79.2B vs –$75.3B prior) and modestly weaker services surplus. - Capital Account: Large net outflows from equities
– Foreign Portfolio Investors (FPIs) pulled $11.4 billion from Indian equities, the sharpest withdrawal since early 2020.
– Notably, some of these funds shifted into Indian bonds under the Fully Accessible Route (FAR), with debt inflows totaling $5 billion. - Overall BoP: –$37.7 billion
– A reversal from the +18.6 billion surplus in Q2, highlighting the scale of capital outflow pressures.
🧭 What this means for FX traders:
The data confirms that India’s external position is deteriorating, despite relative resilience in services exports and contained oil prices. The simultaneous CAD and FPI equity flight marks a rare twin-hit to rupee stability.
While bond inflows offer a partial offset, the structural imbalance between India’s import bill and foreign investment appetite continues to pressure the INR, especially as global risk sentiment remains fragile.
🔍 Three Structural Shifts FX Traders Must Watch
India’s Q3 BoP figures are more than just a quarterly snapshot—they reflect deeper macroeconomic shifts that FX traders cannot afford to ignore. These structural changes are shaping medium-term pressure on the rupee and should inform directional strategies in USD/INR.
① From Equities to Bonds: The FPI Reallocation Signal
Foreign Portfolio Investors pulled $11.4B from Indian equities in Q3. While some of this capital re-entered the bond market via the Fully Accessible Route (FAR), this shift marks a cautious repositioning. FPIs seem to prefer the relative safety of sovereign debt over equities amid global volatility and domestic fiscal concerns.
🧠 Implication: Equity outflows weaken rupee demand, while bond inflows under the FAR route are helpful—but structurally less sticky.
② The Trade Deficit Is Becoming Structural
India’s goods trade deficit ballooned to $79.2B in Q3, continuing a multi-quarter trend. With global growth slowing and oil prices remaining volatile, the country’s import-heavy profile creates persistent current account pressure.
📉 Implication: A structural trade gap amplifies the CAD and limits INR recovery potential, even when service exports remain strong.
③ RBI Intervention Has Its Limits
Market chatter, including popular posts on X, suggests that the RBI is actively intervening to defend the rupee. But history shows that such interventions can only delay—not prevent—trend reversals when fundamentals deteriorate. Traders increasingly view these moves as short-term friction in an otherwise weakening rupee trend.
⚠️ Implication: The dam analogy is apt—intervention may hold temporarily, but macro “floodwaters” could overwhelm it.
Together, these three shifts point to a medium-term bearish bias on INR, even if near-term rebounds occur due to positioning or central bank actions.
🌐 Macroeconomic Pressures Driving USD/INR Trends
While India’s internal fundamentals are shifting, several global macro forces are also shaping the directional outlook for USD/INR. Together, these external and domestic dynamics are tightening the pressure valve on the rupee.
🔺 1. U.S. Tariffs and Global Trade Tensions
Recent tariff announcements by the U.S., including those targeting India, have rattled emerging markets. Although the impact on actual trade volumes may be delayed, the psychological effect on FPI flows is immediate. Global investors tend to flee EM assets at the first sign of protectionist policies.
📉 Rupee Impact: Heightened risk aversion reduces appetite for Indian equities, fueling capital flight and INR depreciation.
🛢️ 2. Oil Prices: Volatility Returns
India imports over 80% of its crude oil, making the rupee highly sensitive to oil price swings. While prices have eased recently, geopolitical risks and supply disruptions continue to loom large. A resurgence in oil prices could widen the trade deficit and reignite inflationary concerns.
🛑 Rupee Impact: Higher oil prices push up the import bill, aggravate the CAD, and add pressure on the RBI to tighten.
🏦 3. Fed Policy and the Dollar’s Path
The Federal Reserve’s next moves on interest rates will be crucial. A prolonged higher-rate environment in the U.S. could strengthen the dollar and redirect capital flows away from India. Conversely, a dovish Fed pivot would offer some relief to EM currencies, including the rupee.
🧭 Rupee Impact: A strong USD challenges INR stability; any Fed dovishness could serve as a near-term catalyst for recovery.
🔄 4. RBI’s Dilemma: Support Growth or Defend the Rupee?
The RBI faces a difficult balancing act—stimulating domestic growth while containing rupee weakness. While OMO bond purchases and FX interventions have helped in the short term, they also signal underlying stress. Market participants are increasingly skeptical about how long such support can last without macro reinforcement.
⚠️ Rupee Impact: Without real improvement in the current account or investor sentiment, RBI tools may prove insufficient.
Taken together, these macro pressures point to ongoing vulnerability in USD/INR, even if temporary strength appears. FX traders should closely track tariff developments, oil markets, and Fed tone shifts for directional cues.
📈 Charting the Rupee – Is USD/INR Set for a Mid-Term Rally?
From a technical perspective, the USD/INR daily chart suggests that the pair remains in a well-supported upward trend, despite periodic pullbacks. As of April 5, 2025, the pair is trading just under 85.80, consolidating after a modest retracement from recent highs.
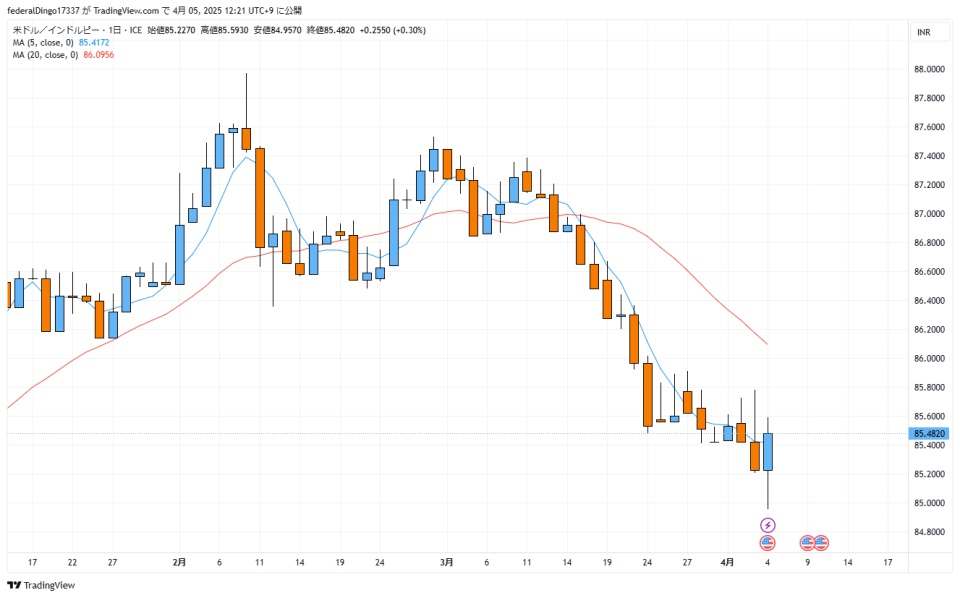
The pair continues to consolidate above key support near 85.40, with resistance forming around 86.40.
🔍 Key Technical Observations:
- Trend Support Holding
Price action shows a series of higher lows since early February, supported by the 50-day moving average. Short-term pullbacks have consistently found buyers around the 85.20–85.40 zone. - Resistance in Sight
The next resistance area lies near the 86.20–86.40 range, where previous rallies have stalled. A confirmed breakout above this level could signal acceleration toward 87.00+. - Momentum Neutral but Biased Higher
RSI remains in the neutral 50–60 range but shows bullish divergence against price dips, indicating potential accumulation. Volume is light, but directional momentum favors the upside. - RBI Activity as Technical Noise
Recent RBI intervention has capped intraday spikes, creating wicks on the daily candles, but has not broken the broader bullish structure.
📌 Chart Outlook Summary:
Unless macro conditions dramatically improve, the chart points toward medium-term INR weakness. The pair’s resilience despite intervention suggests that traders are buying dips in anticipation of further rupee depreciation.
🧠 Trade Implication: FX traders may look for pullback entries in the 85.20–85.40 range with stops below 85.00, targeting 86.50–87.00 on a momentum breakout.
🎯 Strategic Trade Scenarios for the Coming Weeks
With USD/INR trading near key support and macro pressures mounting, traders should consider multiple market scenarios and position accordingly. Below are three strategic paths based on current data, sentiment, and price action.
✅ Scenario A: Bullish USD/INR Breakout
- Trigger: Break above the 86.40 resistance zone on strong dollar momentum or risk-off flows into the U.S.
- Justification: CAD widening, capital outflows, and limited RBI room to defend INR sustainably.
- Strategy:
- Entry: On breakout candle close above 86.40
- Target: 87.50–88.00
- Stop: Below 85.90
- Risk Factor: Sudden reversal in U.S. yields or surprise dovish Fed signal.
⚖️ Scenario B: Sideways Consolidation (Range-Bound)
- Trigger: Continued RBI intervention + mixed global cues (oil stable, no new tariffs).
- Justification: Markets remain indecisive; capital inflows to bonds balance equity outflows.
- Strategy:
- Entry: Buy near 85.20 / Sell near 86.30
- Target: 60–80 pip range
- Stop: Tight stops outside the range
- Risk Factor: Breakout by surprise data (U.S. CPI, India inflation, Fed minutes).
❌ Scenario C: INR Recovery / USD Weakness
- Trigger: Sharp fall in oil prices, soft U.S. CPI, or sudden foreign inflows into Indian bonds/stocks.
- Justification: Some mean reversion, especially if global EM flows turn supportive.
- Strategy:
- Entry: Short USD/INR below 85.00
- Target: 84.20–84.00
- Stop: Above 85.30
- Risk Factor: Market may fade INR strength quickly if fundamentals don’t support it.
🔑 Key Data to Watch:
- India CPI (April 12 release expected)
- U.S. CPI and Fed commentary
- Crude oil volatility (Brent)
- RBI actions and bond auction commentary
- FPI flows and USDINR OI positioning
📣 What Market Voices Are Saying on X
The USD/INR conversation has started to gain traction among seasoned traders and macro-focused accounts on X (formerly Twitter). The platform offers a valuable pulse check on real-time sentiment—and in the case of India’s rupee, the mood is increasingly cautious, if not outright bearish.
Here are some of the most telling posts:
🧠 “Tariff is old news, USDINR is future.” — @mohak_ailani
Tariff is old news, usdinr is future.
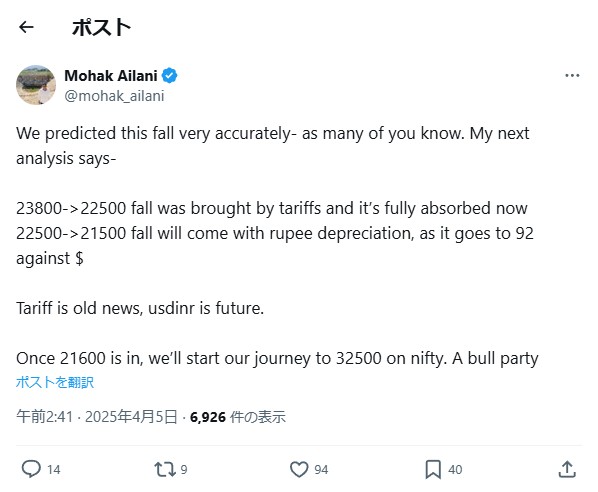
An Elliott Wave trader and data-driven analyst, @mohak_ailani sees USD/INR as the next battleground. He ties past market corrections to trade policy shocks and forecasts the rupee sliding toward 92 per dollar, driven by structural weakness and capital flight.
Takeaway: Market veterans are starting to rotate focus from NIFTY equities to INR currency risk.
⚠️ “Three consecutive closes below 85.43 open the gates to 84.21.” — @CHARTISKING
“The gates to 84.51… maybe even 84.21… will open.”
Technician @CHARTISKING emphasizes how critical the 85.40 level is for trend confirmation. His bearish levels suggest that INR could strengthen—but only if major support breaks, which hasn’t happened yet.
Takeaway: Price is approaching decision zones, and breakout/breakdown setups are in play.
🌧️ “RBI intervention is like damming a river. We’re waiting for the flood.” — @en7mble
RBI intervention is like damming a river. We’re waiting for the flood.
This metaphor captures the skepticism growing among Indian macro watchers. As with past cycles, market players are beginning to question how long RBI intervention can hold back natural depreciation forces.
Takeaway: Intervention fatigue is real. Traders are preparing for a potential policy-driven inflection point.
📉 “INR weakness is now driven by external flows.” — @obsolete_utopia
INR weakness is now driven by external flows.
A macro commentator highlights how FPI equity outflows of $16.9B have pressured INR, while debt inflows (~$5B) only partially offset this drag. She expects future rupee stabilization to depend more on GDP rebound and oil prices than RBI actions alone.
Takeaway: The flow picture is deteriorating, and structural fixes—not patches—are what the rupee needs.
Together, these posts underscore a growing narrative: USD/INR is not a backwater FX pair—it’s becoming a frontline macro trade. For many traders, it’s where policy meets pressure.
🔚 Conclusion – What to Watch and Why It Matters
The USD/INR story is no longer just about interest rate differentials or central bank policy—it’s about structural fragility, global capital rotation, and the growing influence of sentiment-driven flows. India’s widening current account deficit, escalating equity outflows, and a constrained RBI make for a fragile currency setup.
🎯 Key Market Implications:
- Medium-term INR weakness remains the base case, unless India sees a sharp rebound in exports or a reversal in global capital trends.
- Traders should watch for breakout opportunities above the 86.40–86.50 zone or breakdowns below 85.00 for short-term tactical trades.
- Macro catalysts to monitor include:
- U.S. CPI and Fed policy direction
- India’s inflation data and bond market signals
- Crude oil trends and trade policy shifts (e.g., tariffs)
- Ongoing FPI flow dynamics in equities and debt
In a world where most FX headlines revolve around the dollar, euro, or yen, USD/INR offers one of the clearest risk-reward asymmetries heading into Q2 2025.
For macro-minded traders looking beyond the majors, the rupee may soon become a trade you can’t afford to ignore.
📘 Further Reading & Data Sources
To ensure accuracy and provide context for this analysis, key data points were drawn from official sources and macroeconomic publications.
📊 Primary Source:
- Reserve Bank of India (RBI) – Developments in India’s Balance of Payments during the Third Quarter (October–December) of 2024–25